Apollo stands as a key financing partner for some of the most innovative sectors driving our future.
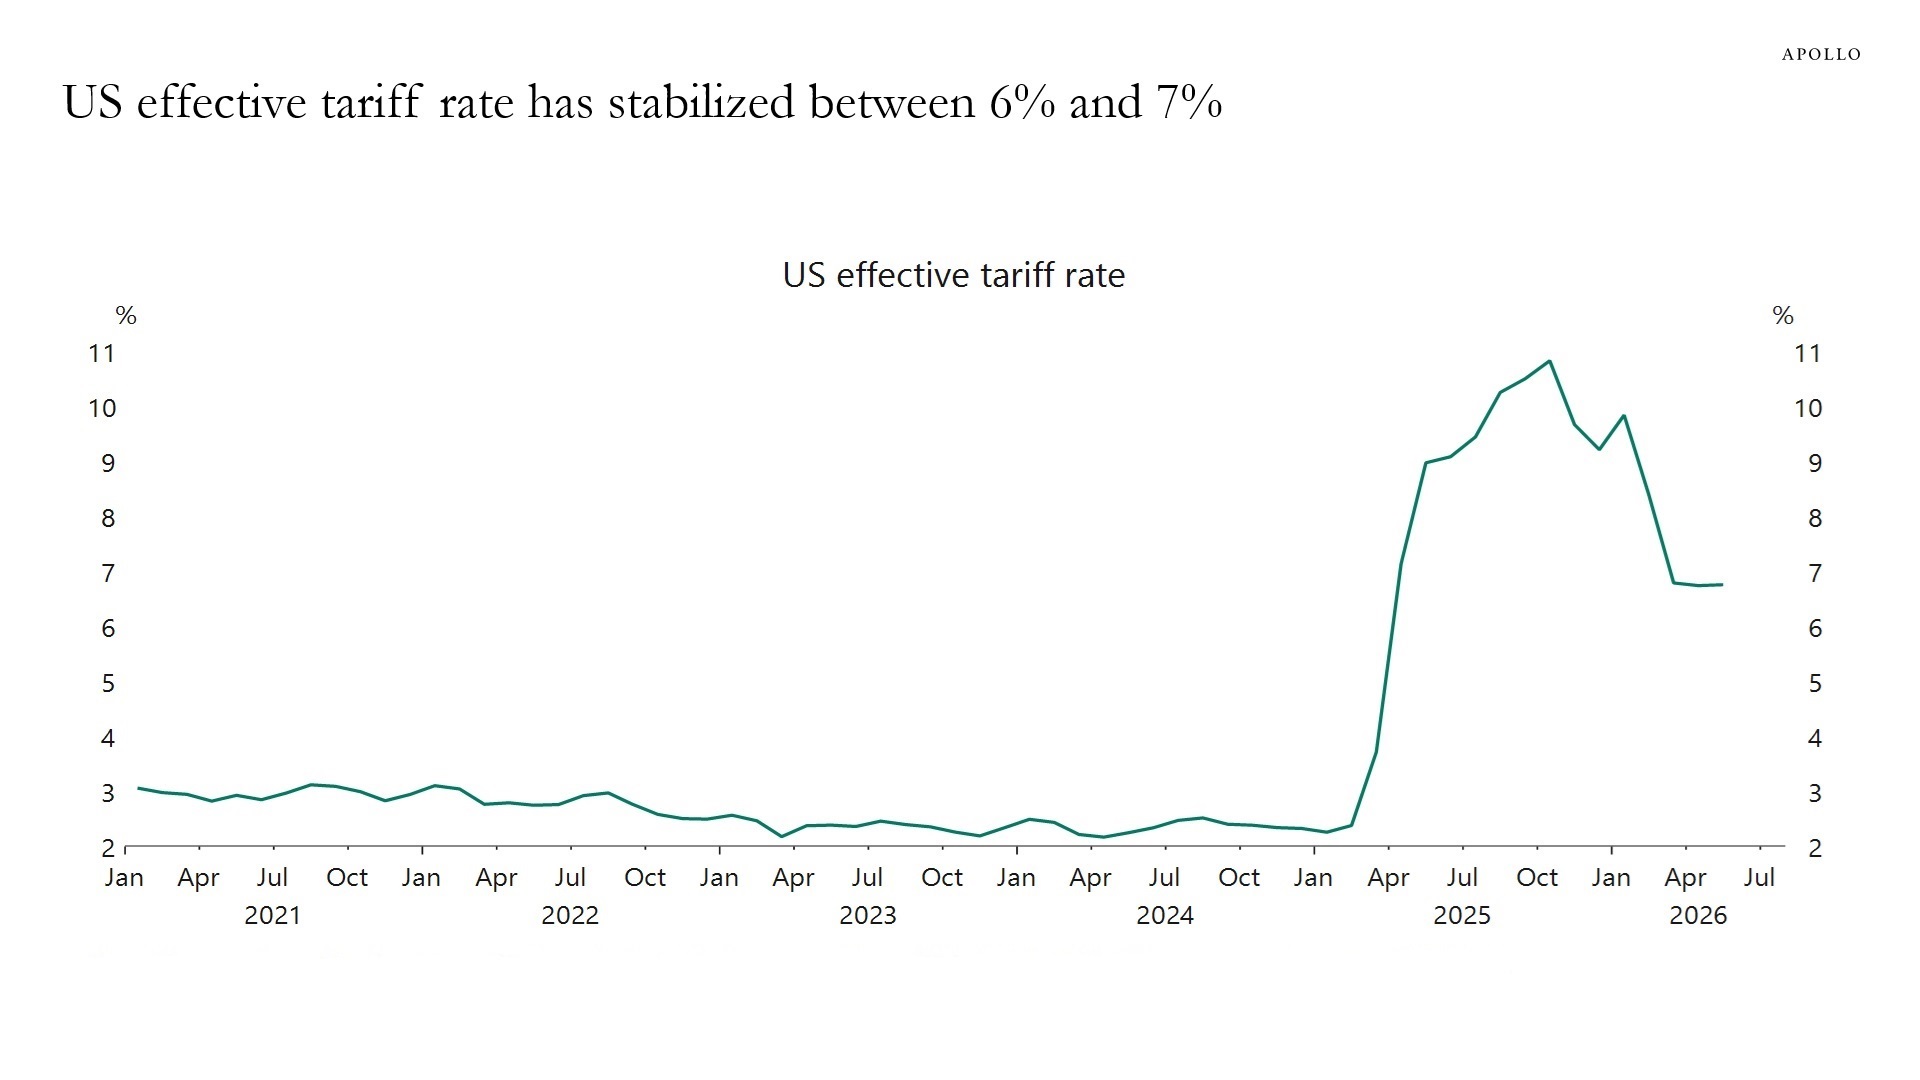
The effective tariff rate has declined from 11% at the peak to between 6% and 7% today, see chart below.
Note: Calculated as monthly census "Calculated Duty" divided by total US goods imports, multiplied by 100. Sources: US Census Bureau, Macrobond, Apollo Chief Economist
See important disclaimers at the bottom of the page.
July 17, 2026
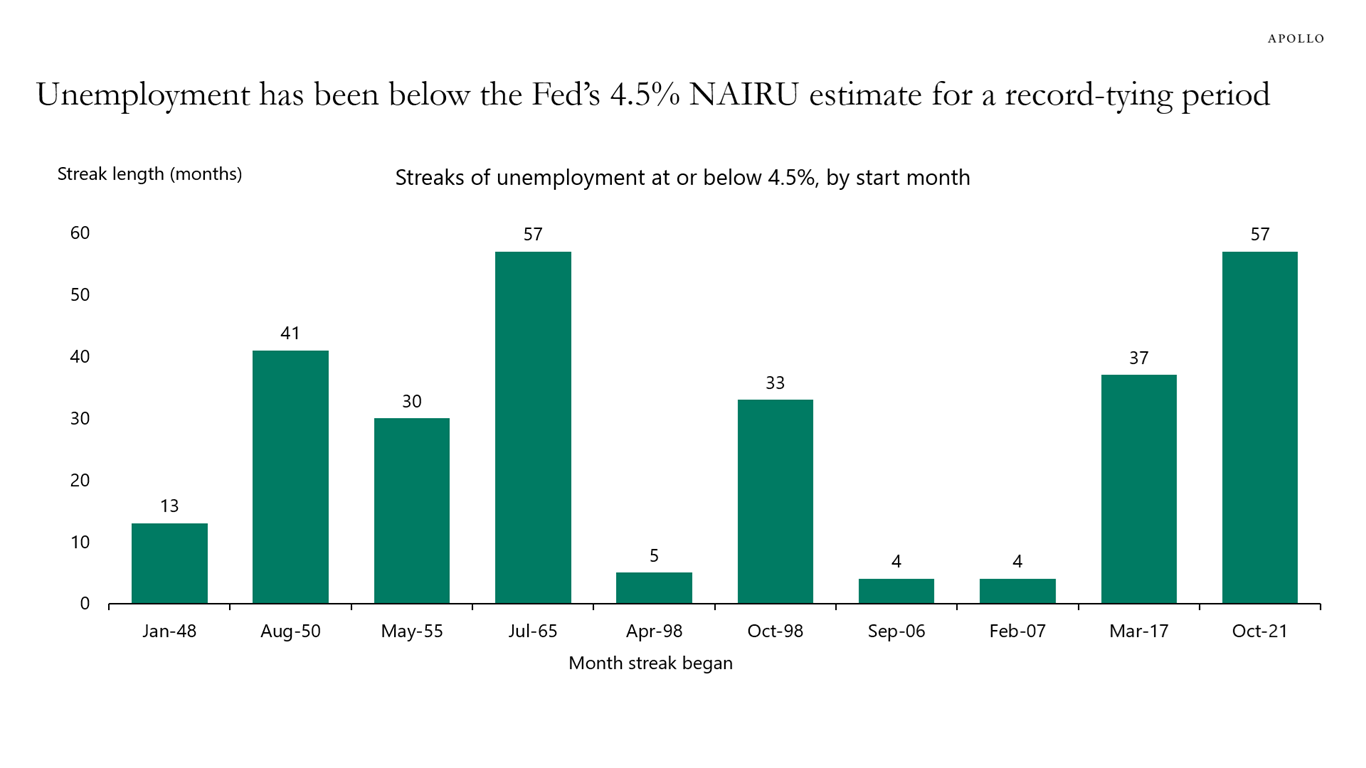
With the Fed estimating the non-accelerating inflation rate of unemployment (NAIRU) at below 4.5%, and unemployment having stayed at or below that level for 57 months, tied for the longest such streak on record, the labor market has been operating in excess-demand territory for an unusually long time. That persistent tightness is a key reason inflation has remained elevated: when unemployment runs below NAIRU, wages and prices face sustained upward pressure.
The chart below puts this streak in historical context. Prior episodes of sub-4.5% unemployment were typically far shorter. The current one is one of the longest on record, which helps explain why the ongoing inflation overshoot since 2021 has been so stubborn.
The bottom line is that a strong economy is the reason why inflation has been high, and only by keeping rates higher for longer can the Fed cool inflation down towards the FOMC’s 2% inflation target.
Sources: US Bureau of Labor Statistics, Apollo Chief Economist
See important disclaimers at the bottom of the page.
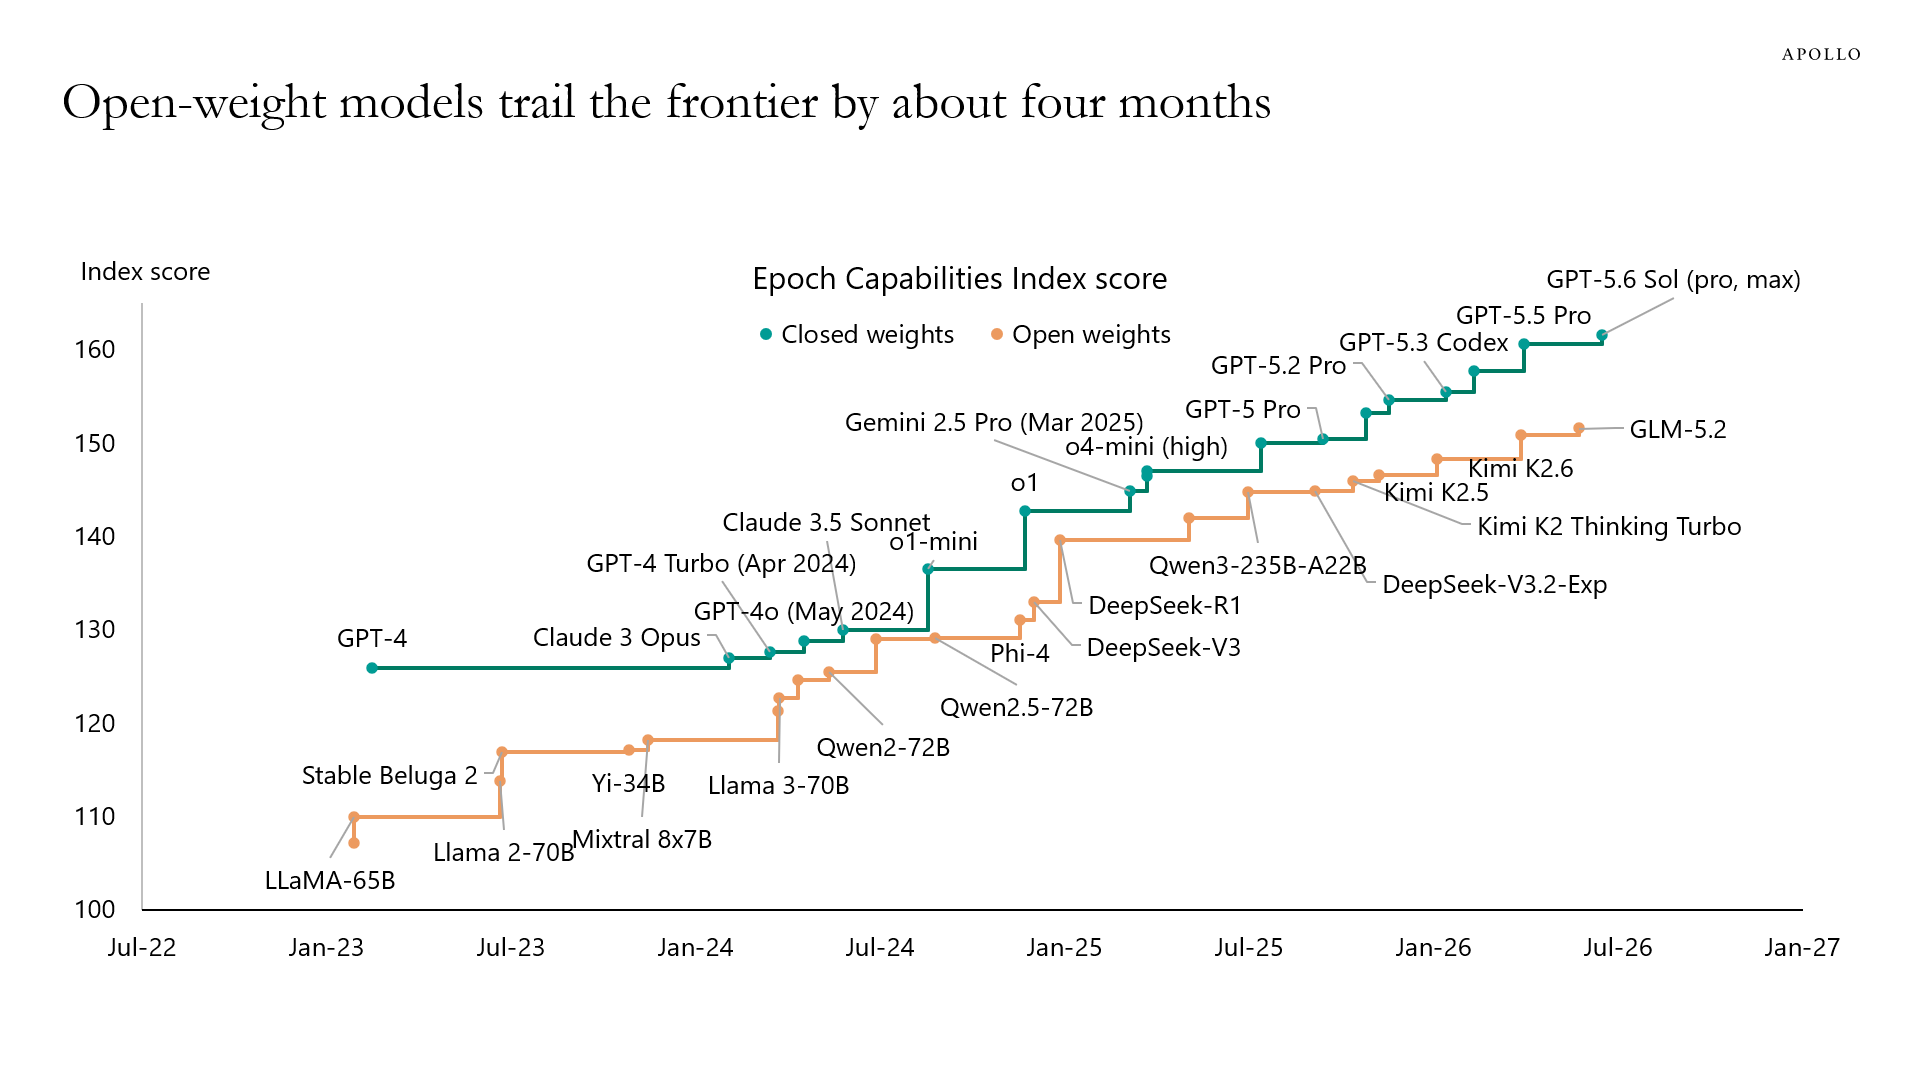
The Epoch Capabilities Index combines scores from many different AI benchmarks into a single "general capability" scale, and the chart below shows that open-weight models trail the closed-weight frontier by around four months. For more, see also here.
Sources: Epoch Capabilities Index | Epoch AI, Apollo Chief Economist
See important disclaimers at the bottom of the page.
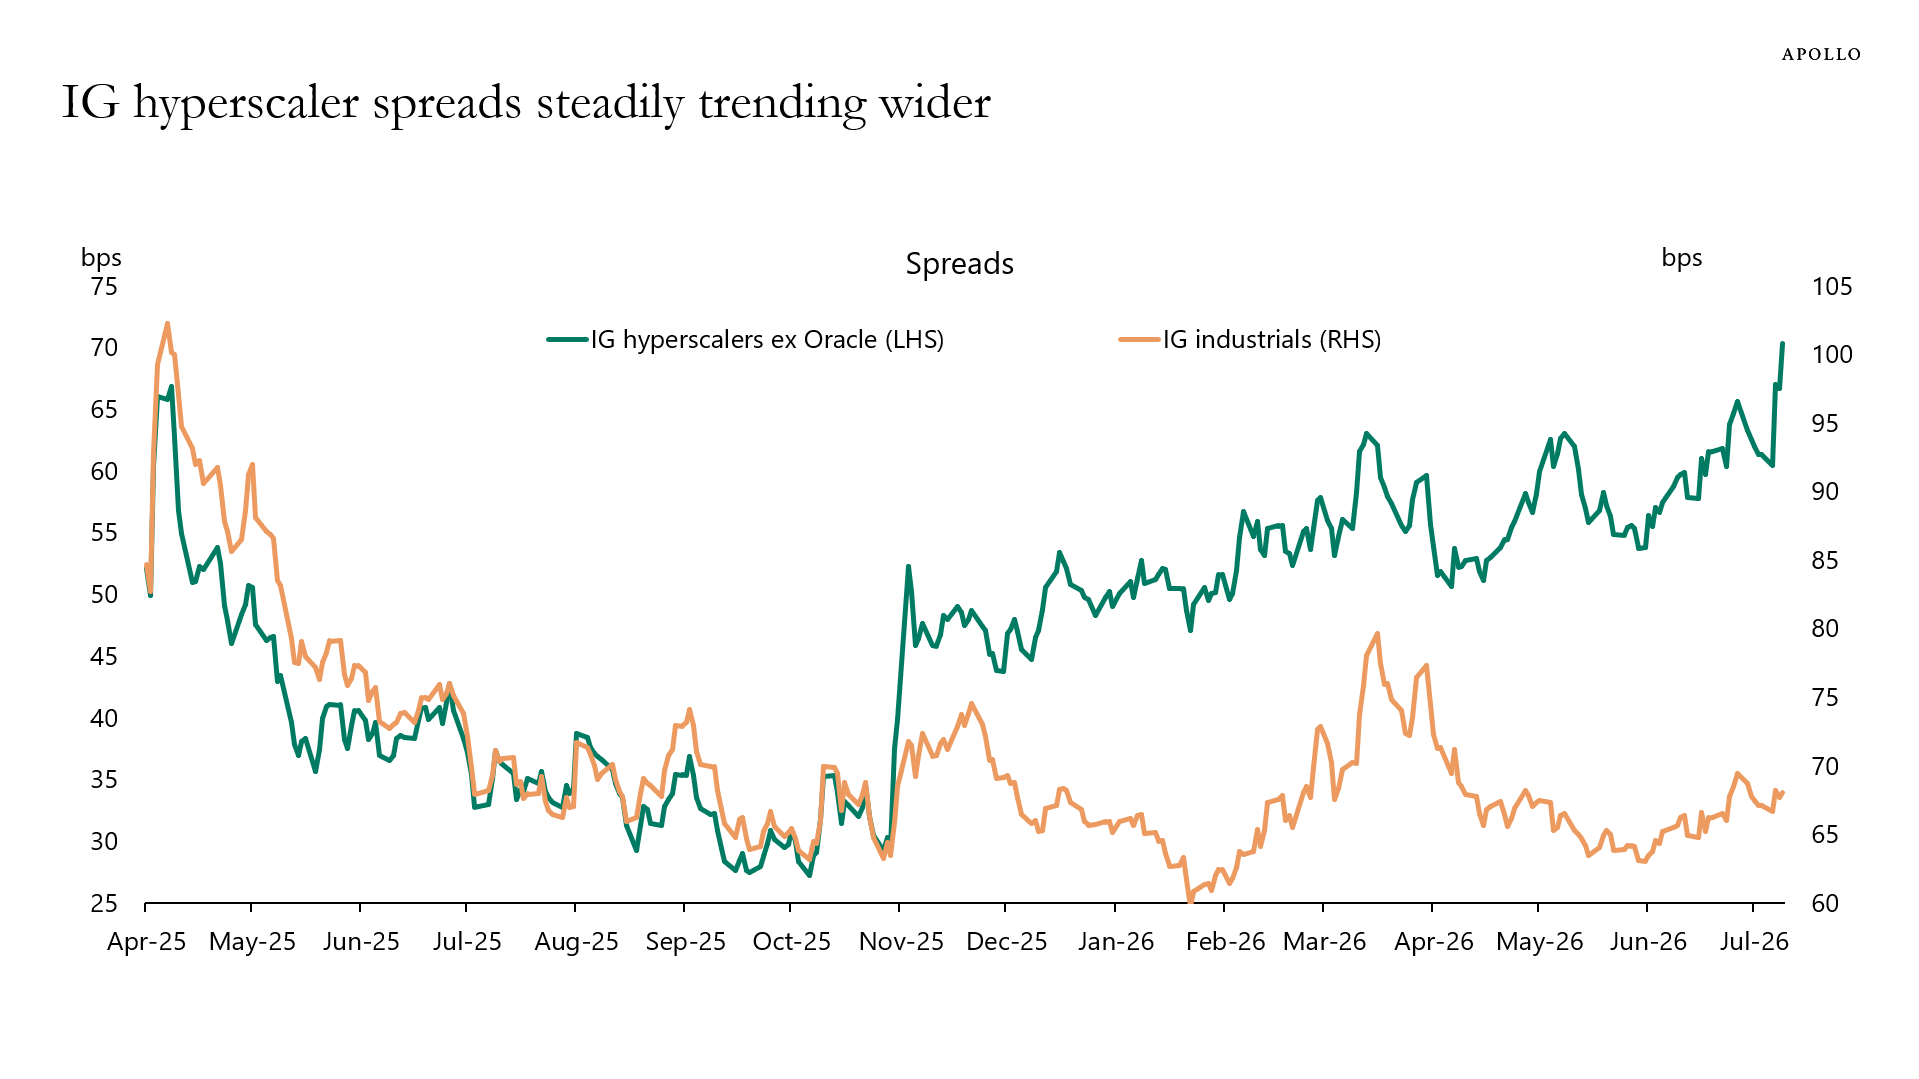
The cover ratio measures how many dollars of investor orders a bond deal receives for every dollar of bonds issued. For hyperscalers, it has fallen from nearly 5x in February 2026 to below 2x in July, suggesting investors may need wider spreads to absorb additional hyperscaler supply, see chart below. For more discussion, see also here.
Note: The cover ratio for initial issuance is the ratio of reported investor orders to the amount issued for an initial debt offering tranche. A cover ratio of 3x, for example, means the deal received orders equal to three times the amount being sold — i.e., it was 3x oversubscribed. Sources: Bloomberg, Apollo Chief Economist
See important disclaimers at the bottom of the page.
July 14, 2026
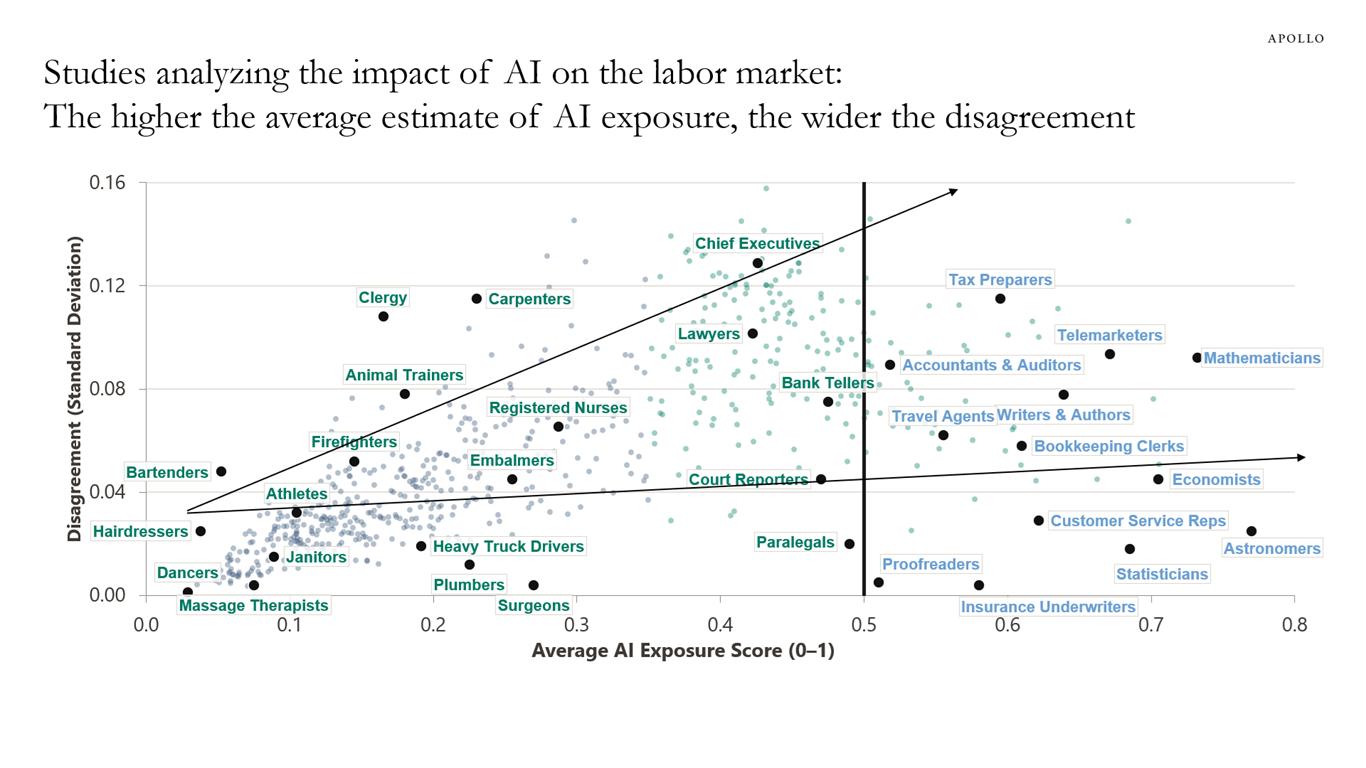
To gauge how much AI affects a job, researchers rate it from 0 to 1 based on how many of its tasks could be, or already are, done with AI. The closer to 1, the more exposed the job.
The trouble is that the studies doing this quantification agree for low-exposure jobs like hairdressers and dancers. But for the high-exposure jobs everyone actually worries about, like tax preparers, telemarketers and mathematicians, they disagree wildly, see chart below.
So the jobs most likely to be called "at risk" are the ones we understand least. These roles tend to involve many different tasks, and while AI can do some, others are hard to automate, which is exactly why the measures disagree.
The Yale Budget Lab came to a similar conclusion here, and my colleague Sania Edlich and I will keep digging into this in upcoming Sparks. For more, see also here.
Note: Academic studies used: Massenkoff and McCrory (2026), Felten et al. (2021), Eisfeldt et al. (2023), Eloundou et al. (2024), Tomlinson et al. (2025). Source: Apollo Chief Economist
See important disclaimers at the bottom of the page.
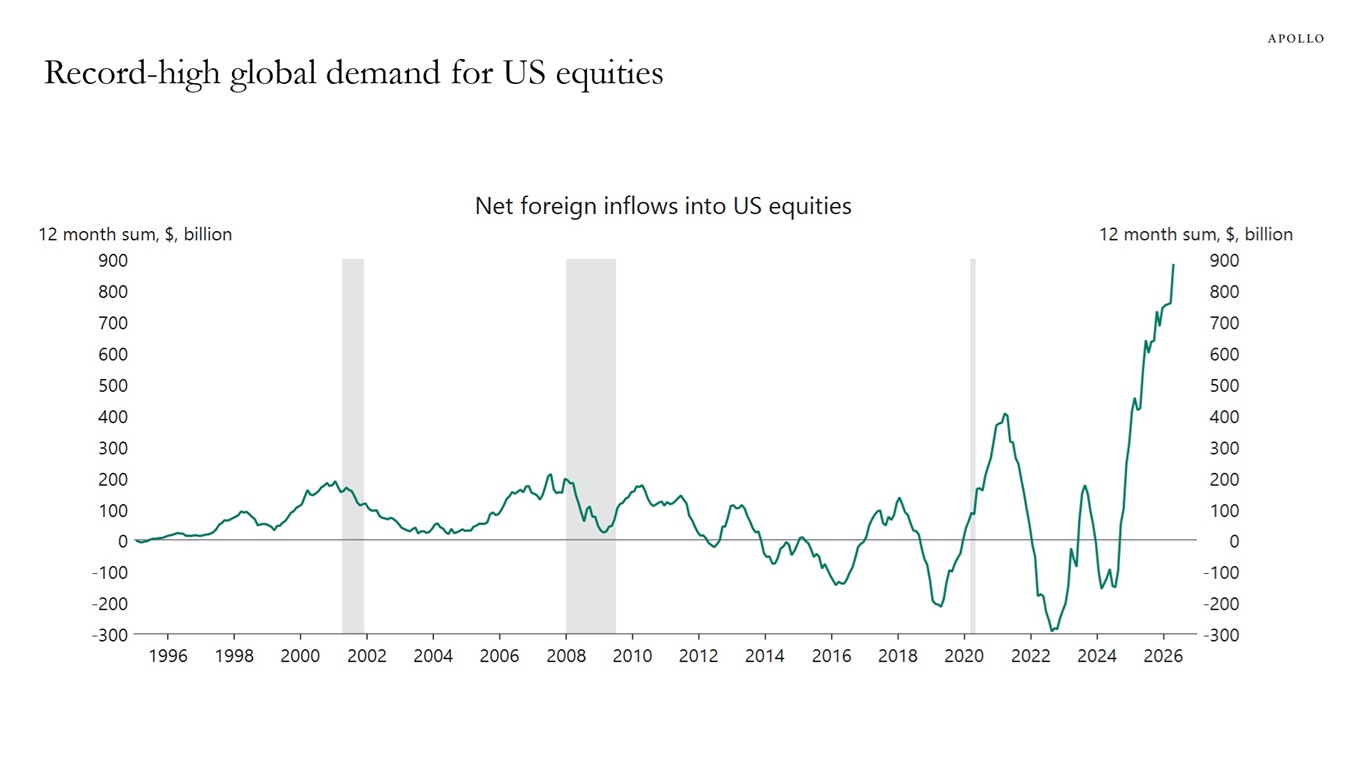
Net foreign inflows into US equities have surged to a record high, driven in large part by overseas investors seeking AI exposure they cannot get in their home markets, see chart below.
With most foreign equity investors not hedging their FX risk, the bottom line is that if AI disappoints, the resulting pullback in these inflows would be a significant downside risk to the US dollar.
Note: Includes both private and official. Sources: US Department of Treasury, Macrobond, Apollo Chief Economist
See important disclaimers at the bottom of the page.
July 12, 2026
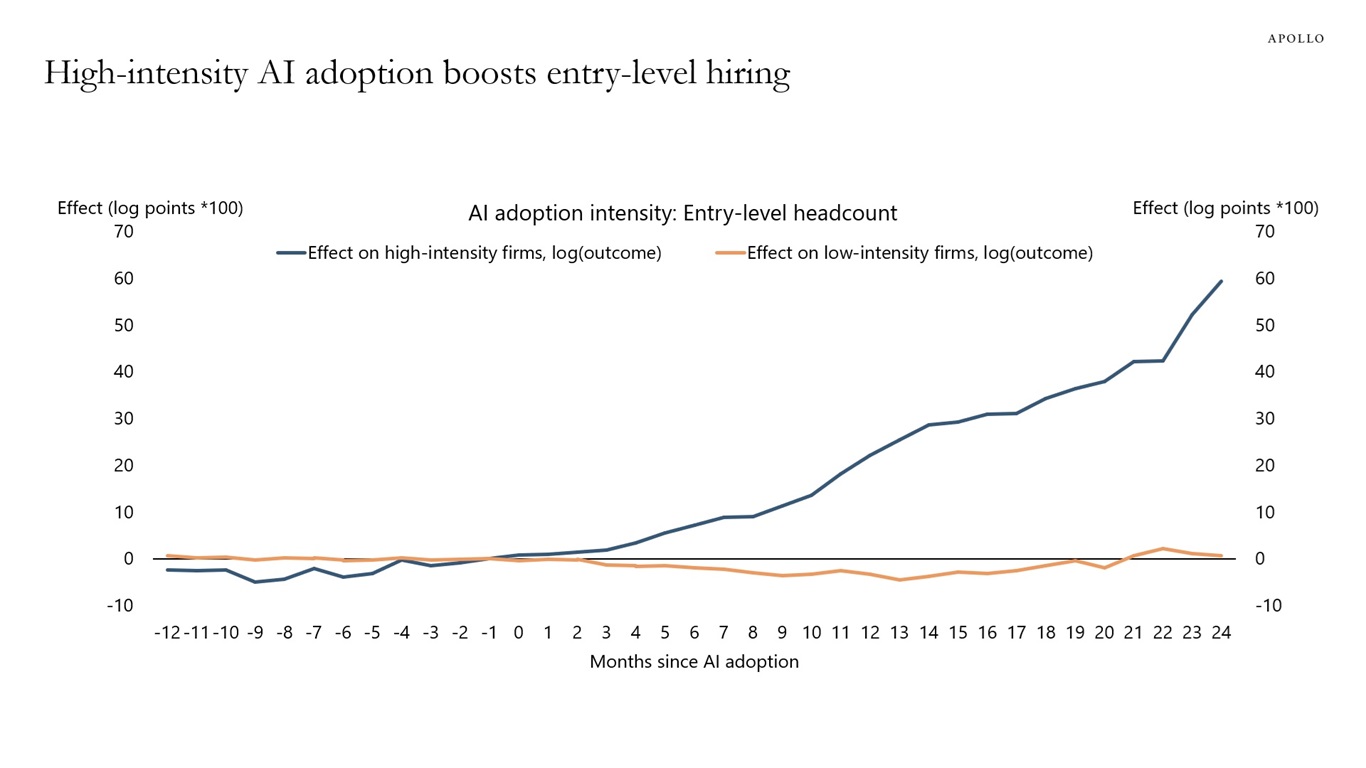
A new study from Ramp, linking observed AI spending to workforce records across 21,559 US firms, finds that companies adopting AI grow their headcount 10% over the two years following adoption.
These gains are entirely driven by high-intensity adopters with entry-level jobs rising by about 12%, suggesting that heavy AI investment is complementing workforce growth rather than replacing workers, see chart below and here.
Sources: Ramp, Revelio Labs; Kharazian, Simon and Stevens (2026), "A New Look at AI's Impact on Jobs: Firm-Level AI Spending and Workforce Adjustment”; Apollo Chief Economist
See important disclaimers at the bottom of the page.
July 11, 2026
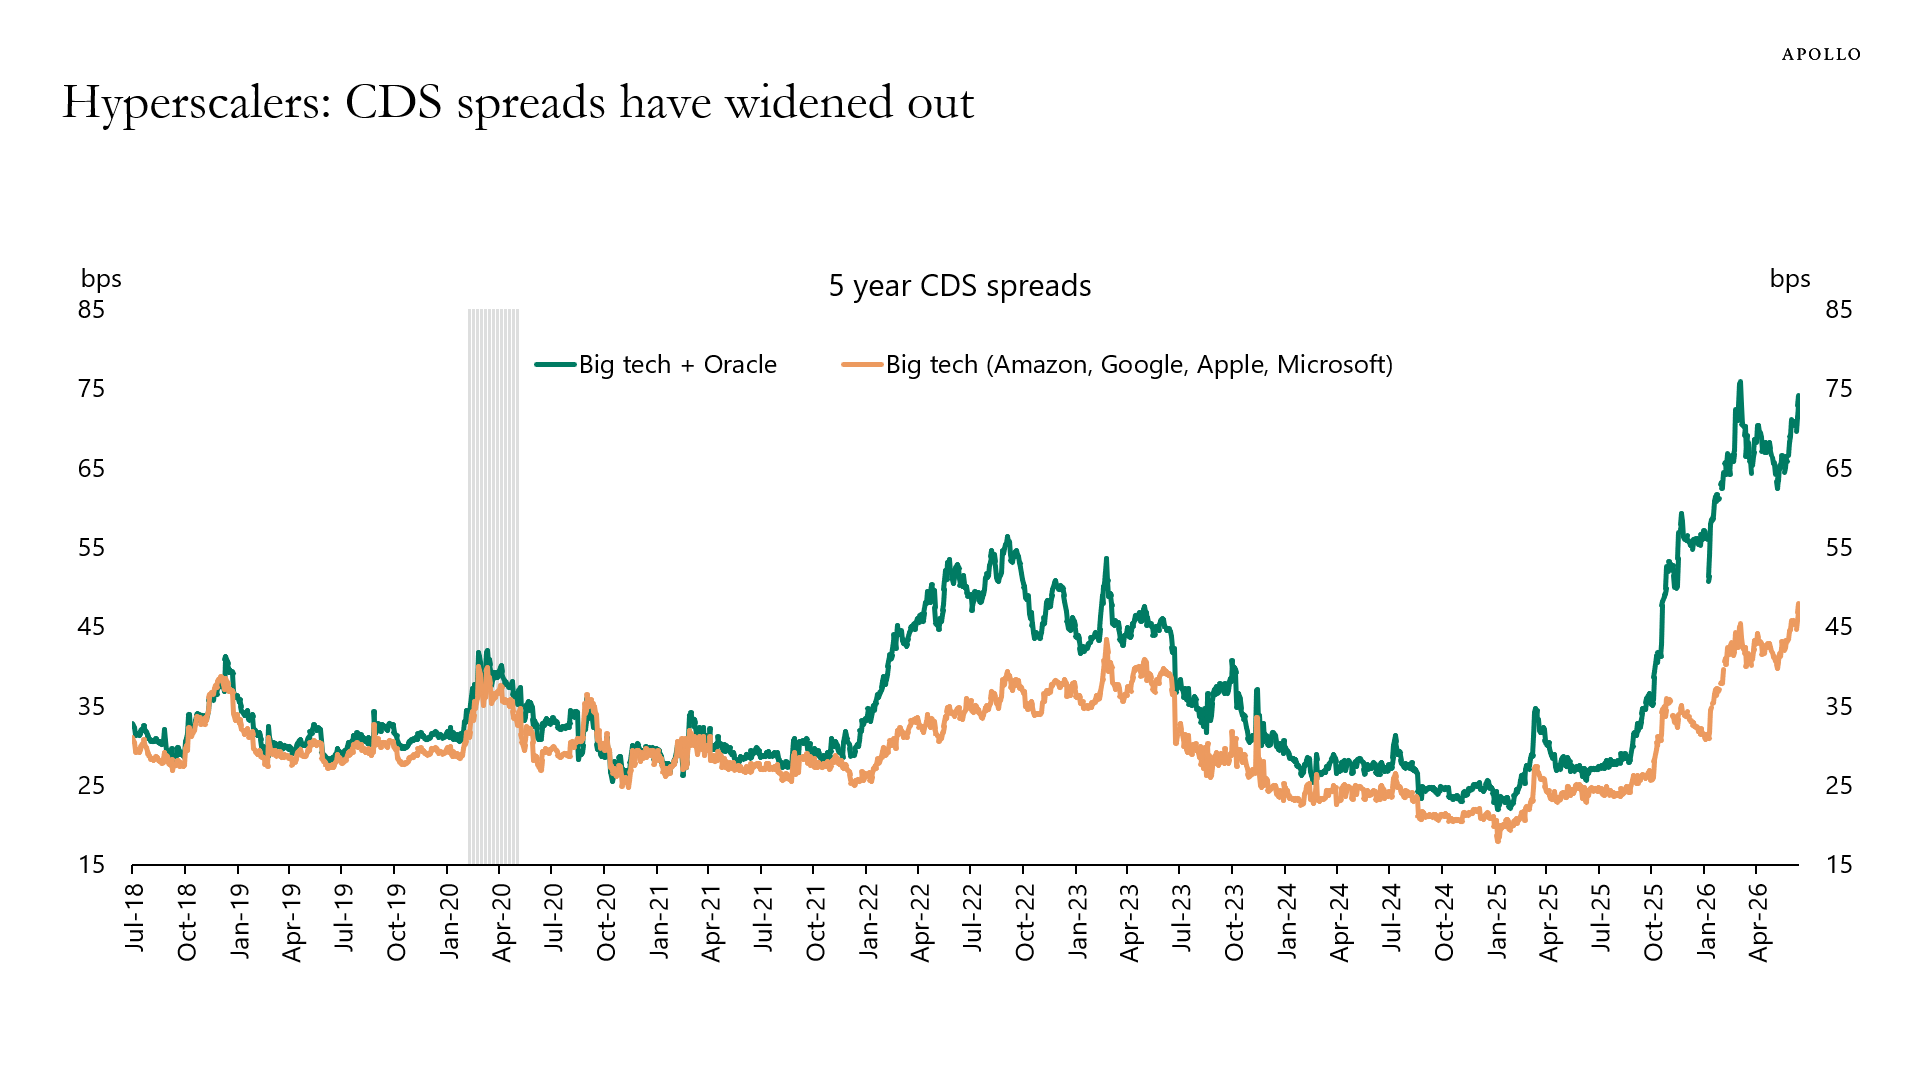
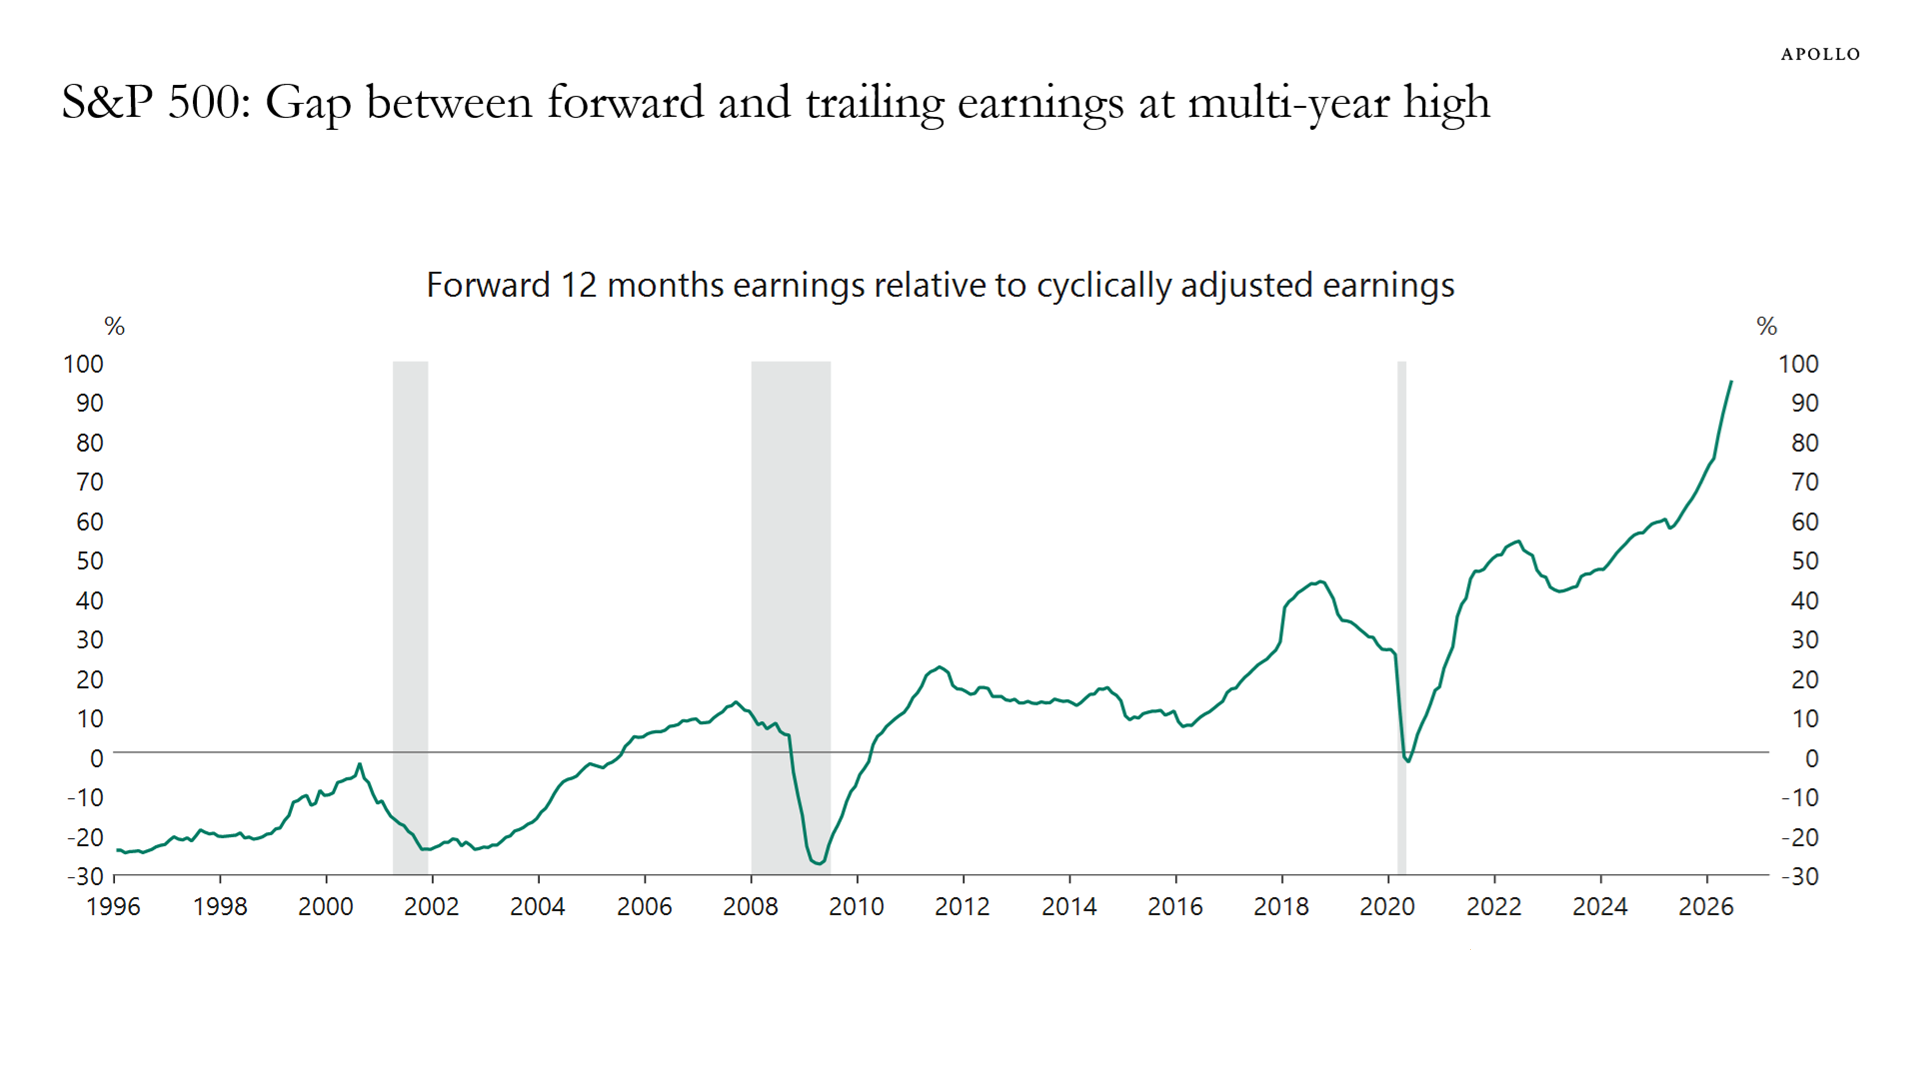
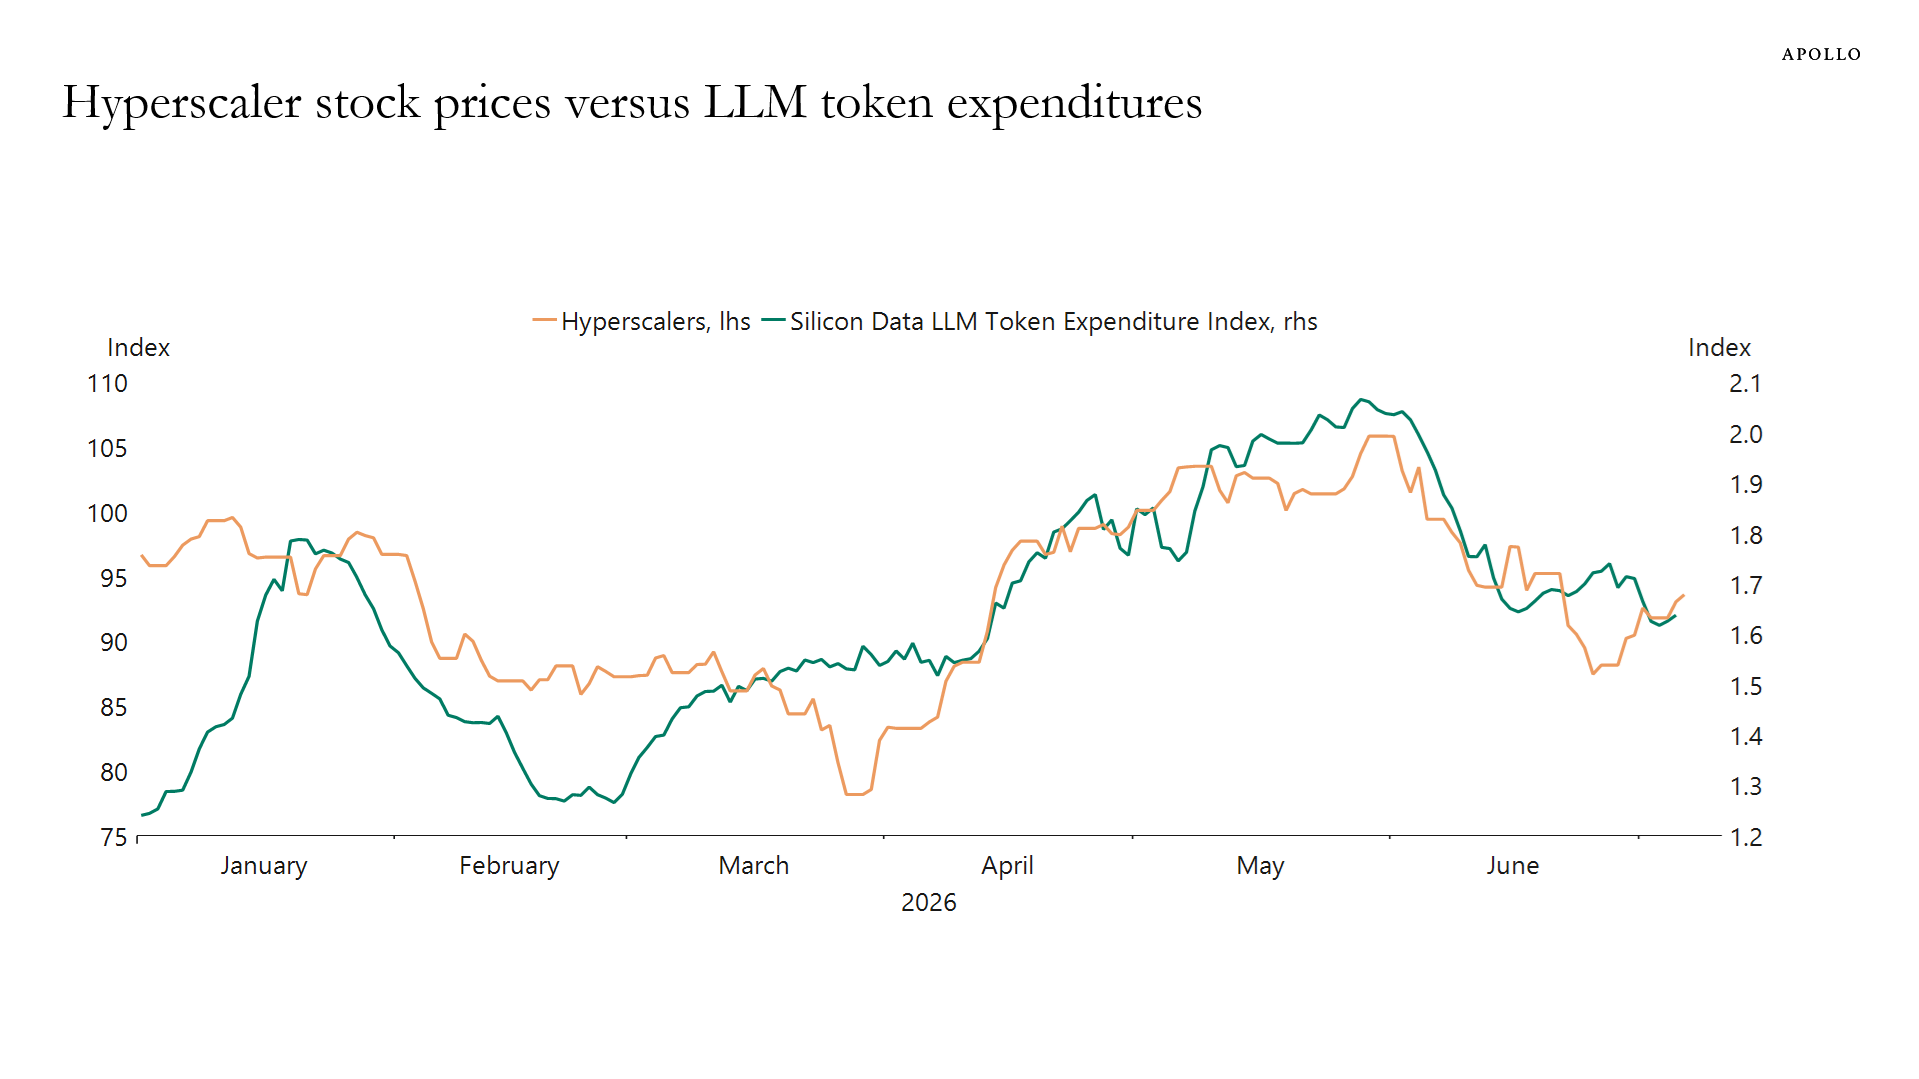
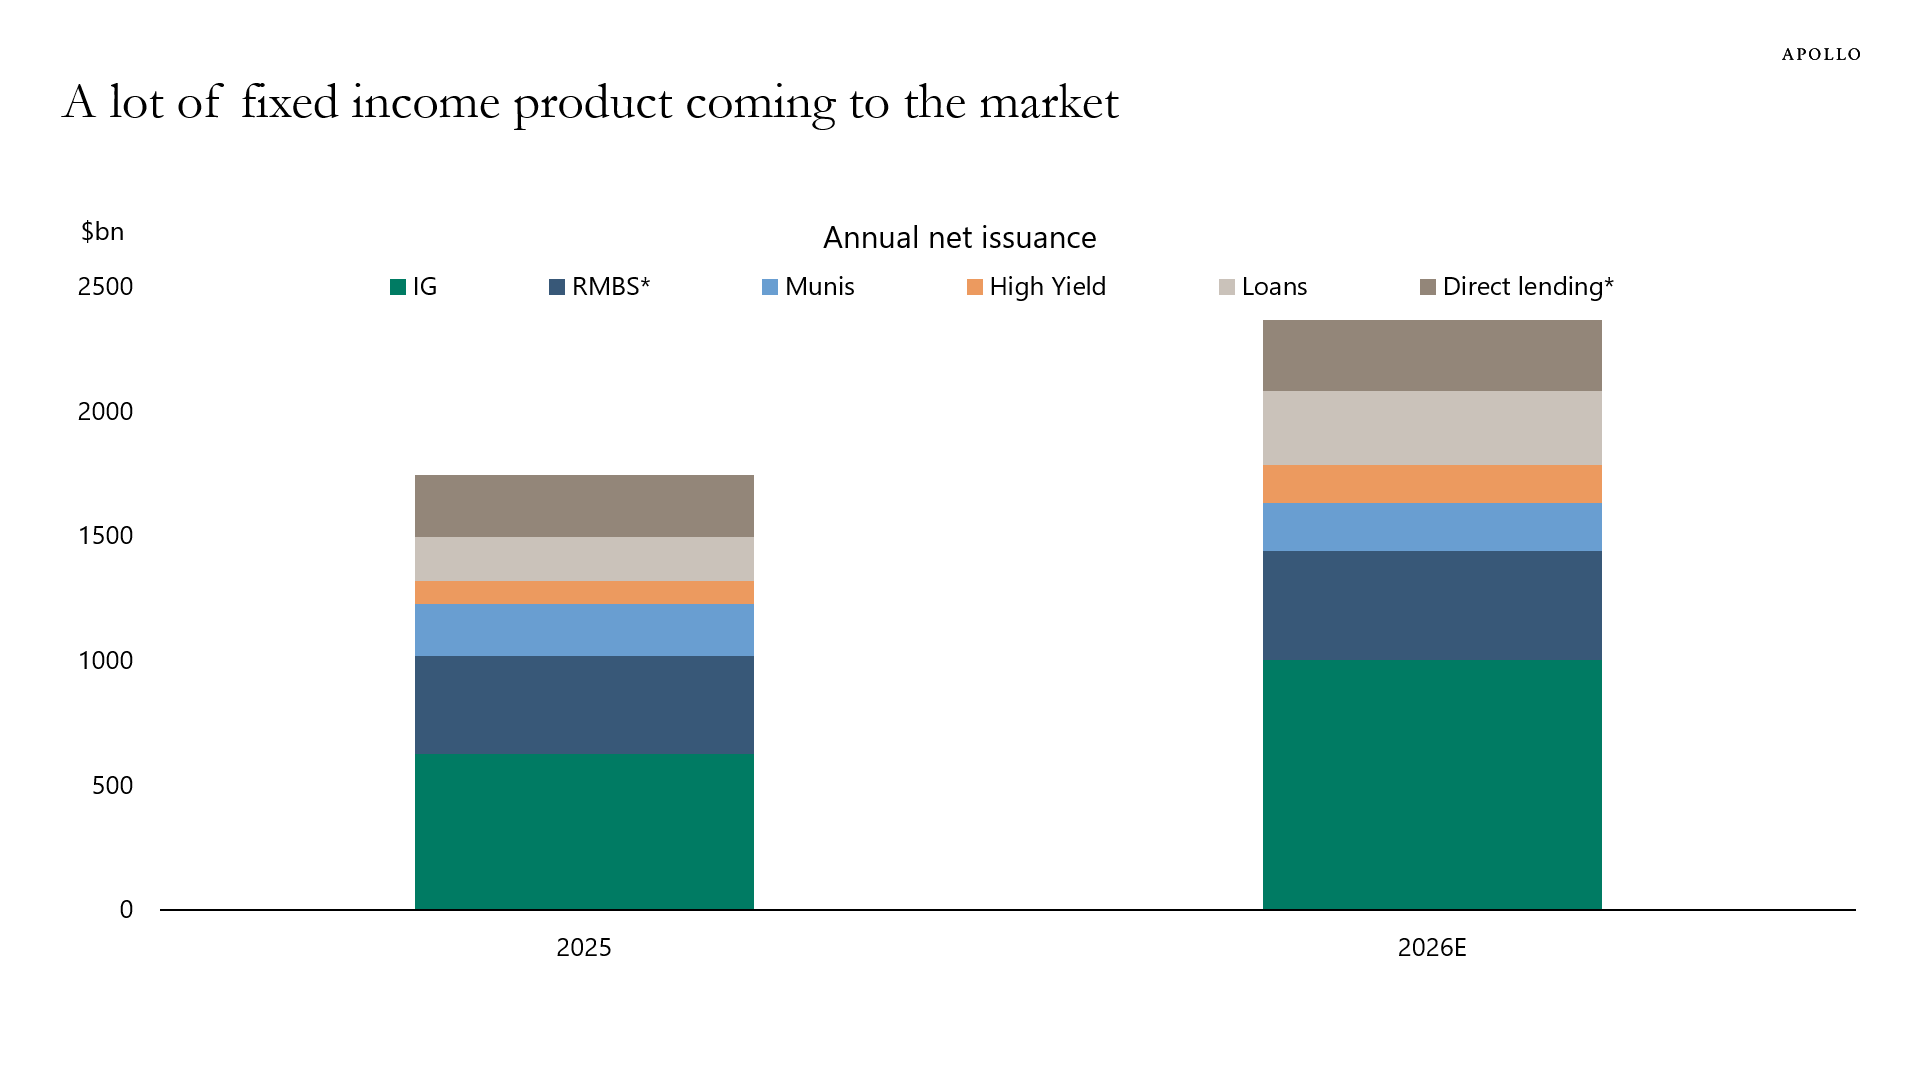
Hyperscaler debt issuance continues to grow, reshaping dynamics across financial markets. This chart book tracks the AI trade across hyperscaler equity prices, credit spreads, CDS and earnings expectations, bringing together the signals that matter most as markets weigh the pace and payoff of AI investments. For more, see here.
Note: 7 to 11 year maturity. Sources: ICE BofA Indices, Apollo Chief Economist
Sources: Bloomberg, Apollo Chief Economist
Note: Percentage calculated as (forward earnings / cyclically adjusted earnings -1). Cyclically adjusted earnings is the 10-year average of real earnings series from Robert Shiller. Sources: Bloomberg, Robert Shiller, Macrobond, Apollo Chief Economist
Note: The Silicon Data LLM Token Expenditure Index measures the effective cost of using large language models (LLMs), expressed as the price per million tokens. A rising index indicates higher spending on AI model usage, while a falling index suggests declining inference costs. The UBS Hyperscalers Basket Index tracks the performance of the largest US-listed cloud infrastructure companies supporting AI workloads. The basket is equally weighted and rebalanced semi-annually. Sources: Bloomberg, Macrobond, Apollo Chief Economist
Note: *RMBS shown excluding fed purchases and bills, *Direct lending includes gross originations, and 2026 is annualized. Sources: MS, Barclays, PitchBook, Apollo Analysts, Apollo Chief Economist
See important disclaimers at the bottom of the page.
July 10, 2026
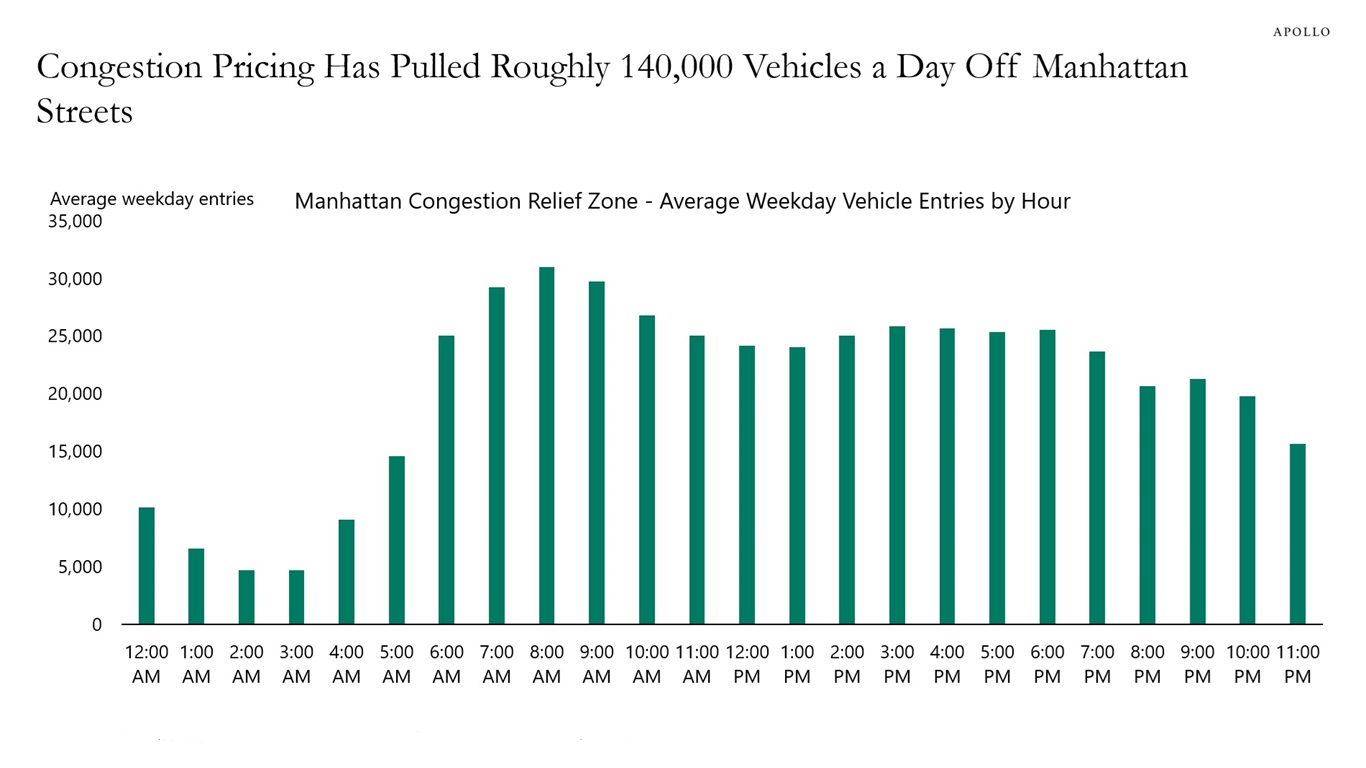
Since congestion pricing launched in January 2025, about 500,000 vehicles enter Manhattan's Congestion Relief Zone on a typical weekday. The MTA estimates daily entries have fallen roughly 13% from their pre-toll baseline of about 640,000. Entries peak near 31,000 at 8 am, then hold a broad plateau through the afternoon rather than spiking again at evening rush, see chart below.
Note: Vehicles entering the zone below 60th Street. Average of all weekdays (Mon–Fri) since January 5, 2025. Sources: MTA, Apollo Chief Economist
See important disclaimers at the bottom of the page.
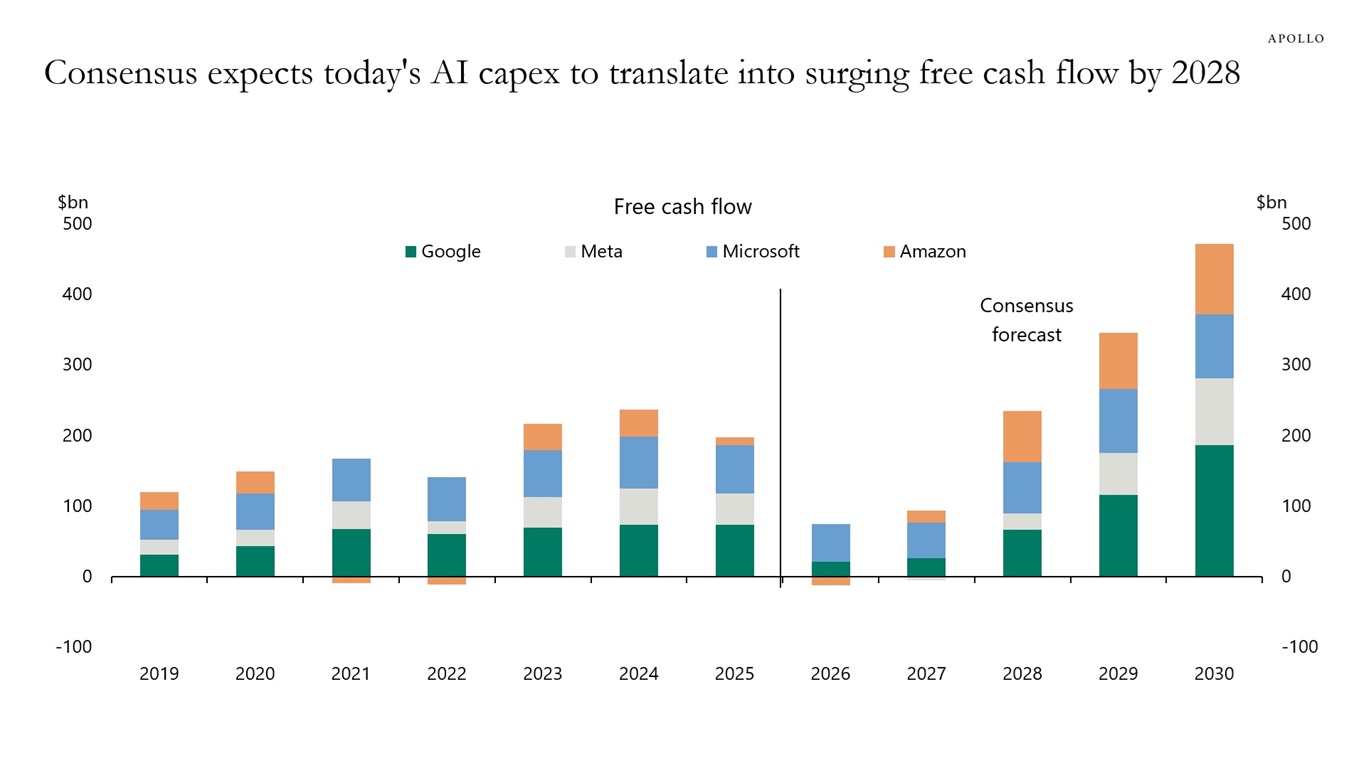
Consensus expects free cash flow for the hyperscalers to more than double over the coming years, see the first chart below.
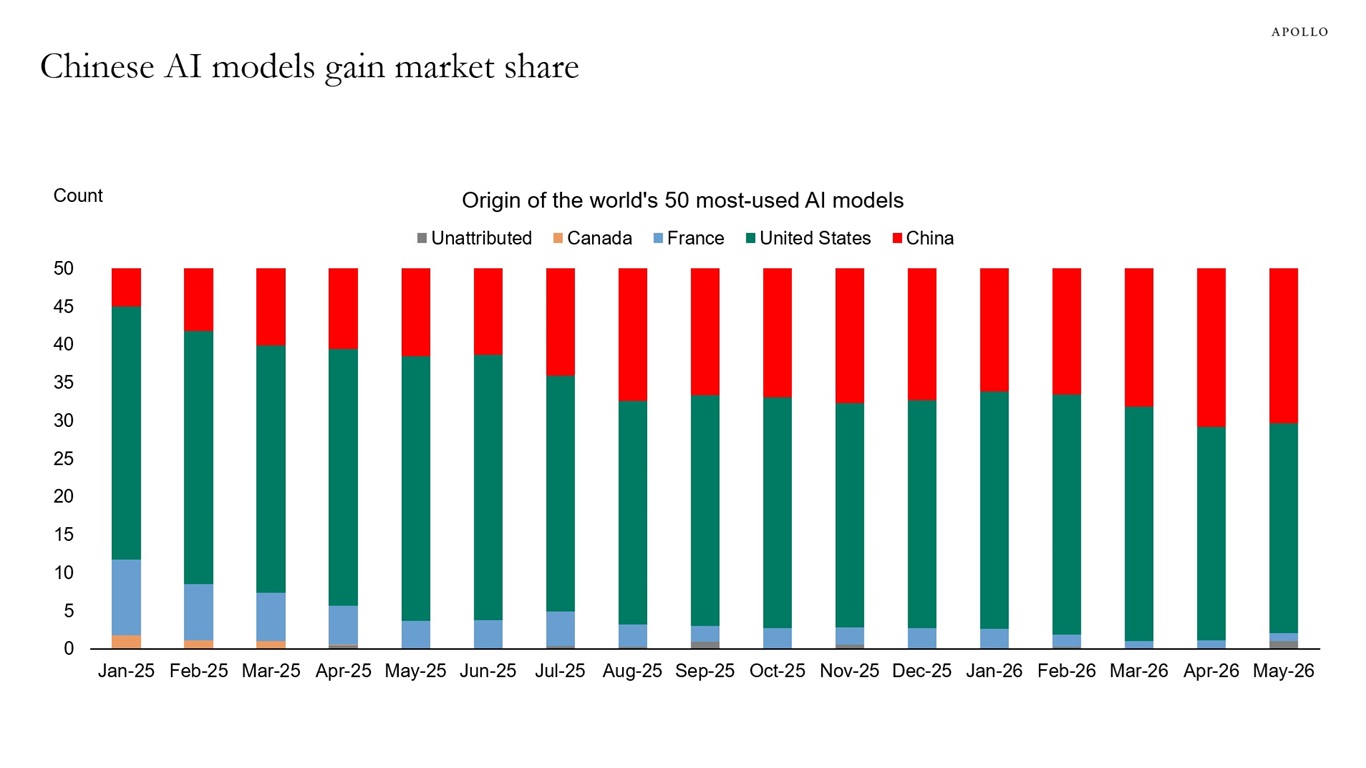
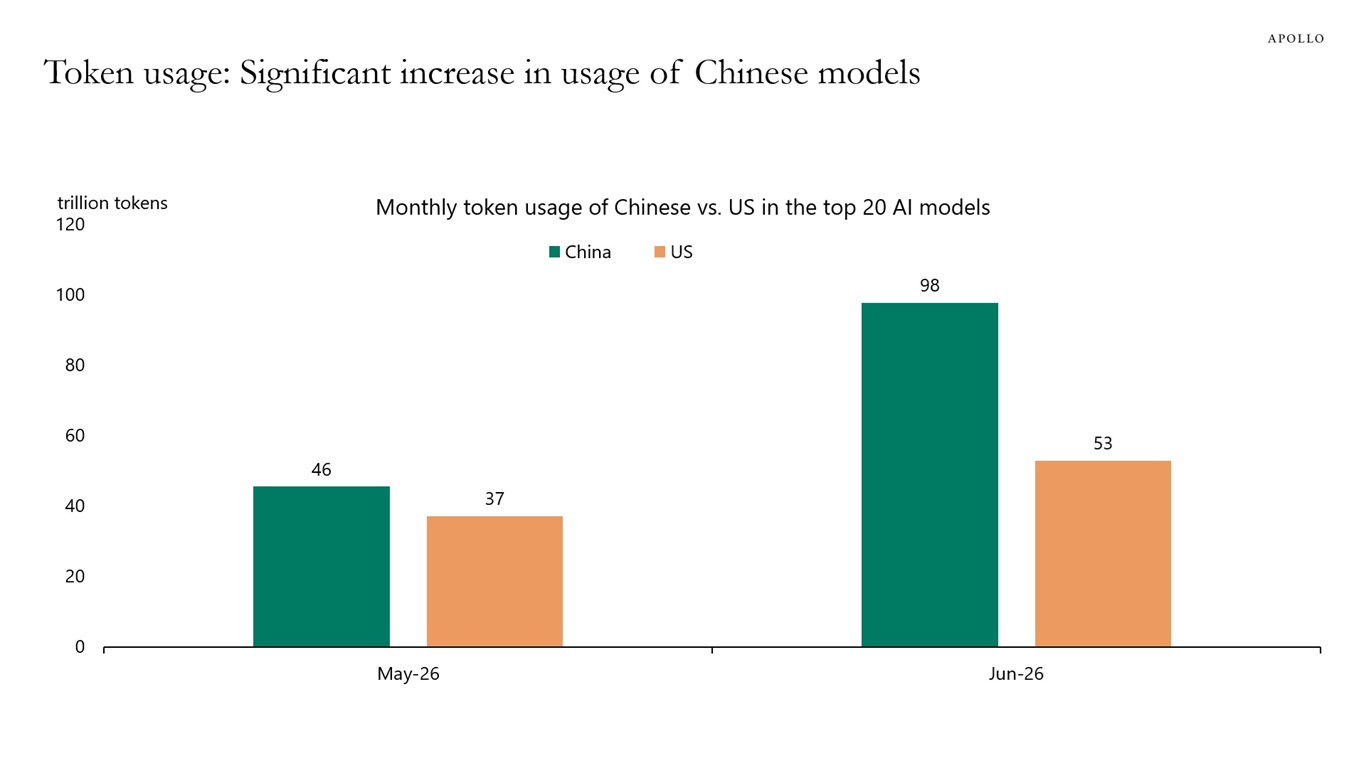
But what if the payoff takes longer than consensus assumes? That question is particularly pressing given that token prices continue to decline and Chinese models are gaining ground, both in their share of the world's most-used models and in token usage, where they now lead their US counterparts among the top 20 models, see the second and third charts.
If Chinese models keep gaining and token prices keep falling, the hyperscaler cash flows expected may prove too optimistic.
What are the consequences if the AI payoff comes slower than expected in the first chart?
1) Cash flows and earnings disappoint: the projected free cash flow surge slips later while committed capex and heavy depreciation hit on schedule, squeezing margins and marking down the forecast in the first chart.
2) A Mag 7 sell-off that takes the market with it: equity prices built on a fast payoff re-rate, and because the Magnificent 7 now account for so much of the indices, the pain can't stay contained, it spreads to chips, power, data centers and the S&P 500 as a whole.
3) Balance sheets stretch and credit risk rises: with internal cash unable to cover spending, hyperscalers lean further on debt, raising leverage and inviting possible ratings downgrades if profits lag.
The bottom line is that AI has been the one thing holding up both the economy and markets, and with so much riding on so few names, a slower payoff wouldn't just be a sector problem, it would risk tipping the economy into recession and the S&P 500 into a correction.
Sources: FactSet, Apollo Chief Economist
Sources: OurWorldinData.org, Apollo Chief Economist
Sources: LLM Rankings | OpenRouter, Apollo Chief Economist
See important disclaimers at the bottom of the page.