Apollo stands as a key financing partner for some of the most innovative sectors driving our future.
Three events converge next week that could dramatically reshape market narratives:
1) Hyperscaler earnings (July 29-30)
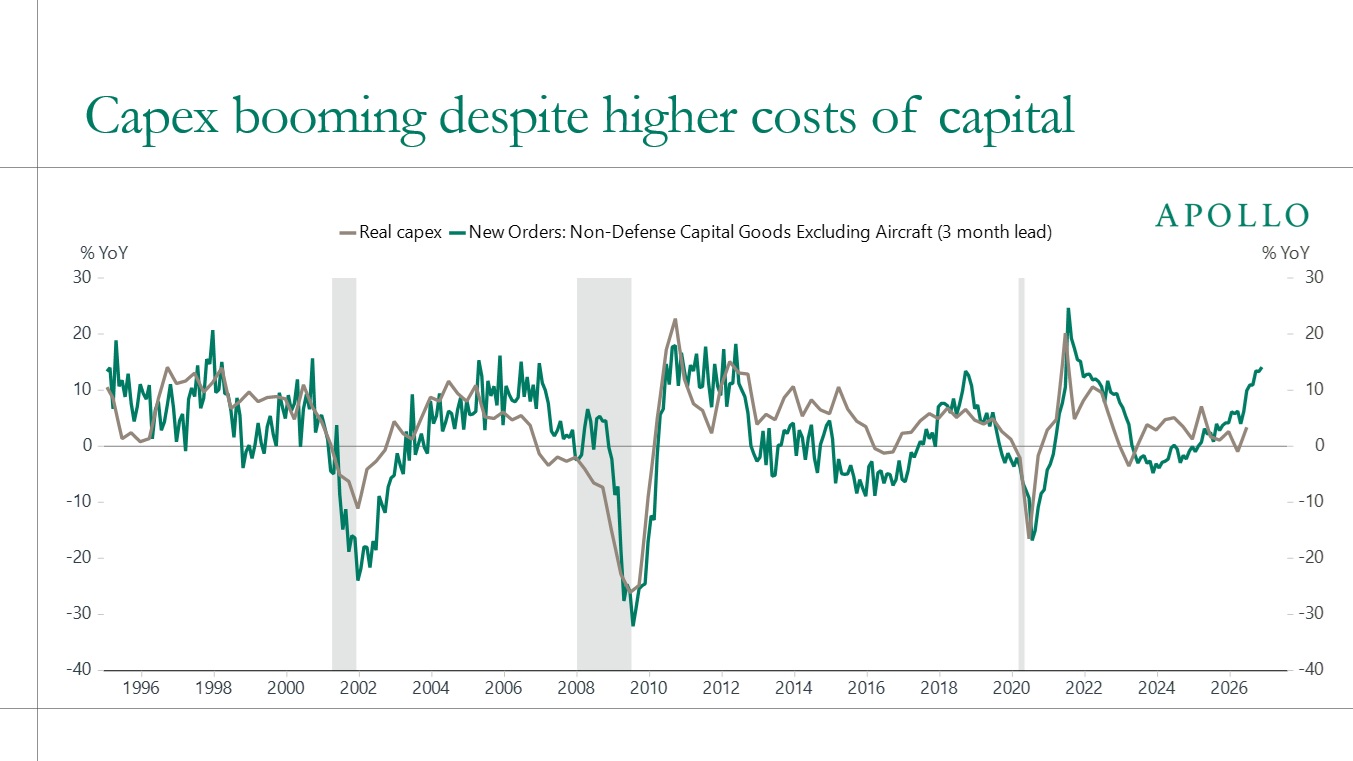
Microsoft, Meta and Amazon report back-to-back, and investors are watching the AI trade obsessively. Are capex investments, earnings growth and returns accelerating or stalling?
2) Fed meeting (July 28-29)
Nine of 18 Fed officials project a rate hike this year. Forward guidance has been eliminated, making individual Fed speakers the only remaining signal of intent. Recent Fedspeak has been unambiguously hawkish on inflation. With no roadmap, markets will parse every word for clues about the path ahead.
3) Iran conflict re-escalating
The Strait of Hormuz is a critical chokepoint. Escalation could constrict oil flows, deplete global reserves, and spike energy prices, adding fuel to the inflation battle the Fed is waging and putting further upward pressure on yields.
Bottom line: Next week answers three separate questions: Are AI capex investments panning out? Can the Fed contain inflation? Will geopolitics stay manageable? Markets are currently betting yes on all three.
Source: Apollo Chief Economist
See important disclaimers at the bottom of the page.
July 20, 2026
Since the Fed raised interest rates in 2022, annuity sales have basically doubled and stayed at that higher level. In turn, these strong sales are creating strong institutional demand for both public and private credit, see chart below.
Sources: Bloomberg, Apollo Chief Economist
See important disclaimers at the bottom of the page.
July 19, 2026
Six years after the pandemic, weekend subway ridership in New York has recovered to nearly 90% of its 2019 level while weekdays remain stuck near 75%, consistent with Nick Bloom's finding that the shift to hybrid work has permanently thinned the weekday commute, see chart below and here.
Note: Average number of subway riders on a typical day in each month, split by weekday vs. weekend, Jan 2017 – Jun 2026. Sources: MTA, Apollo Chief Economist
See important disclaimers at the bottom of the page.
The effective tariff rate has declined from 11% at the peak to between 6% and 7% today, see chart below.
Note: Calculated as monthly census "Calculated Duty" divided by total US goods imports, multiplied by 100. Sources: US Census Bureau, Macrobond, Apollo Chief Economist
See important disclaimers at the bottom of the page.
July 17, 2026
With the Fed estimating the non-accelerating inflation rate of unemployment (NAIRU) at below 4.5%, and unemployment having stayed at or below that level for 57 months, tied for the longest such streak on record, the labor market has been operating in excess-demand territory for an unusually long time. That persistent tightness is a key reason inflation has remained elevated: when unemployment runs below NAIRU, wages and prices face sustained upward pressure.
The chart below puts this streak in historical context. Prior episodes of sub-4.5% unemployment were typically far shorter. The current one is one of the longest on record, which helps explain why the ongoing inflation overshoot since 2021 has been so stubborn.
The bottom line is that a strong economy is the reason why inflation has been high, and only by keeping rates higher for longer can the Fed cool inflation down towards the FOMC’s 2% inflation target.
Sources: US Bureau of Labor Statistics, Apollo Chief Economist
See important disclaimers at the bottom of the page.
The Epoch Capabilities Index combines scores from many different AI benchmarks into a single "general capability" scale, and the chart below shows that open-weight models trail the closed-weight frontier by around four months. For more, see also here.
Sources: Epoch Capabilities Index | Epoch AI, Apollo Chief Economist
See important disclaimers at the bottom of the page.
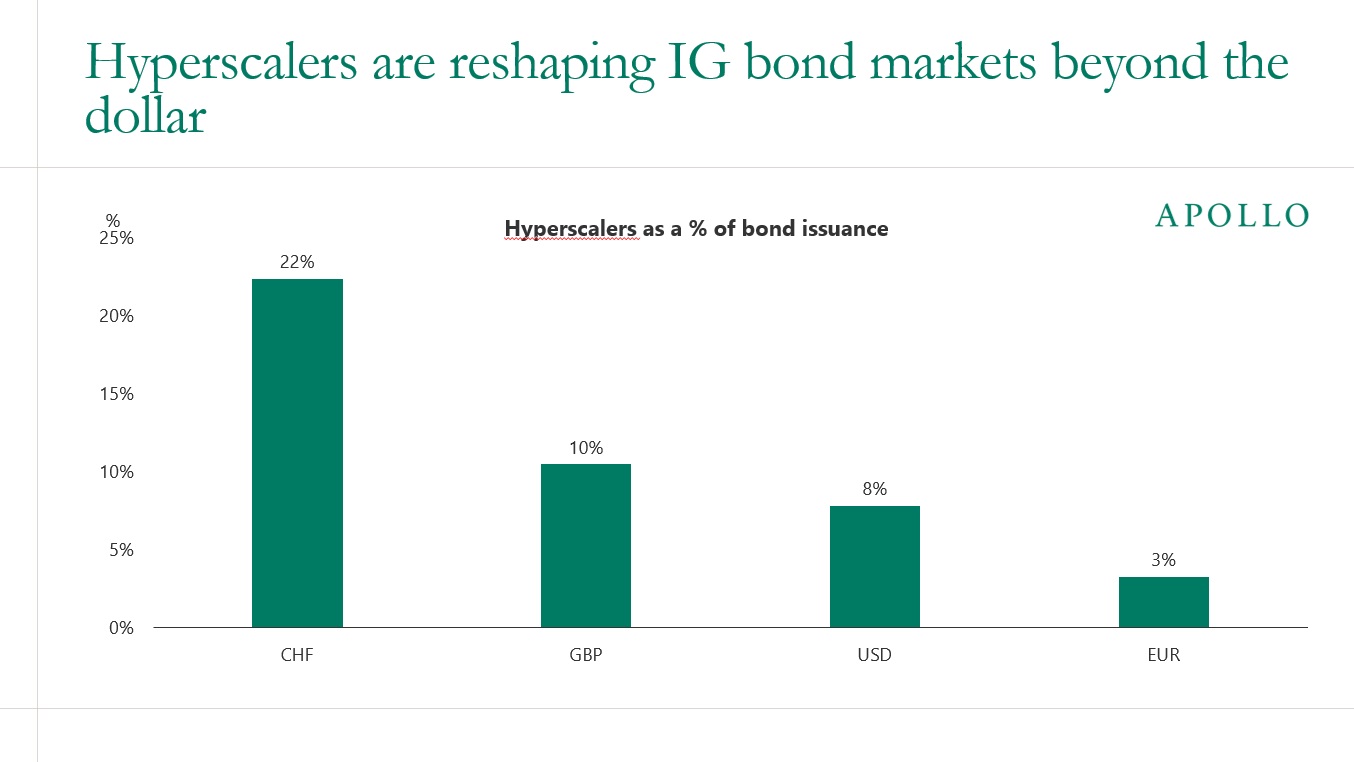
The cover ratio measures how many dollars of investor orders a bond deal receives for every dollar of bonds issued. For hyperscalers, it has fallen from nearly 5x in February 2026 to below 2x in July, suggesting investors may need wider spreads to absorb additional hyperscaler supply, see chart below. For more discussion, see also here.
Note: The cover ratio for initial issuance is the ratio of reported investor orders to the amount issued for an initial debt offering tranche. A cover ratio of 3x, for example, means the deal received orders equal to three times the amount being sold — i.e., it was 3x oversubscribed. Sources: Bloomberg, Apollo Chief Economist
See important disclaimers at the bottom of the page.
July 14, 2026
To gauge how much AI affects a job, researchers rate it from 0 to 1 based on how many of its tasks could be, or already are, done with AI. The closer to 1, the more exposed the job.
The trouble is that the studies doing this quantification agree for low-exposure jobs like hairdressers and dancers. But for the high-exposure jobs everyone actually worries about, like tax preparers, telemarketers and mathematicians, they disagree wildly, see chart below.
So the jobs most likely to be called "at risk" are the ones we understand least. These roles tend to involve many different tasks, and while AI can do some, others are hard to automate, which is exactly why the measures disagree.
The Yale Budget Lab came to a similar conclusion here, and my colleague Sania Edlich and I will keep digging into this in upcoming Sparks. For more, see also here.
Note: Academic studies used: Massenkoff and McCrory (2026), Felten et al. (2021), Eisfeldt et al. (2023), Eloundou et al. (2024), Tomlinson et al. (2025). Source: Apollo Chief Economist
See important disclaimers at the bottom of the page.
Net foreign inflows into US equities have surged to a record high, driven in large part by overseas investors seeking AI exposure they cannot get in their home markets, see chart below.
With most foreign equity investors not hedging their FX risk, the bottom line is that if AI disappoints, the resulting pullback in these inflows would be a significant downside risk to the US dollar.
Note: Includes both private and official. Sources: US Department of Treasury, Macrobond, Apollo Chief Economist
See important disclaimers at the bottom of the page.
July 12, 2026
A new study from Ramp, linking observed AI spending to workforce records across 21,559 US firms, finds that companies adopting AI grow their headcount 10% over the two years following adoption.
These gains are entirely driven by high-intensity adopters with entry-level jobs rising by about 12%, suggesting that heavy AI investment is complementing workforce growth rather than replacing workers, see chart below and here.
Sources: Ramp, Revelio Labs; Kharazian, Simon and Stevens (2026), "A New Look at AI's Impact on Jobs: Firm-Level AI Spending and Workforce Adjustment”; Apollo Chief Economist
See important disclaimers at the bottom of the page.