Apollo stands as a key financing partner for some of the most innovative sectors driving our future.
October 25, 2026
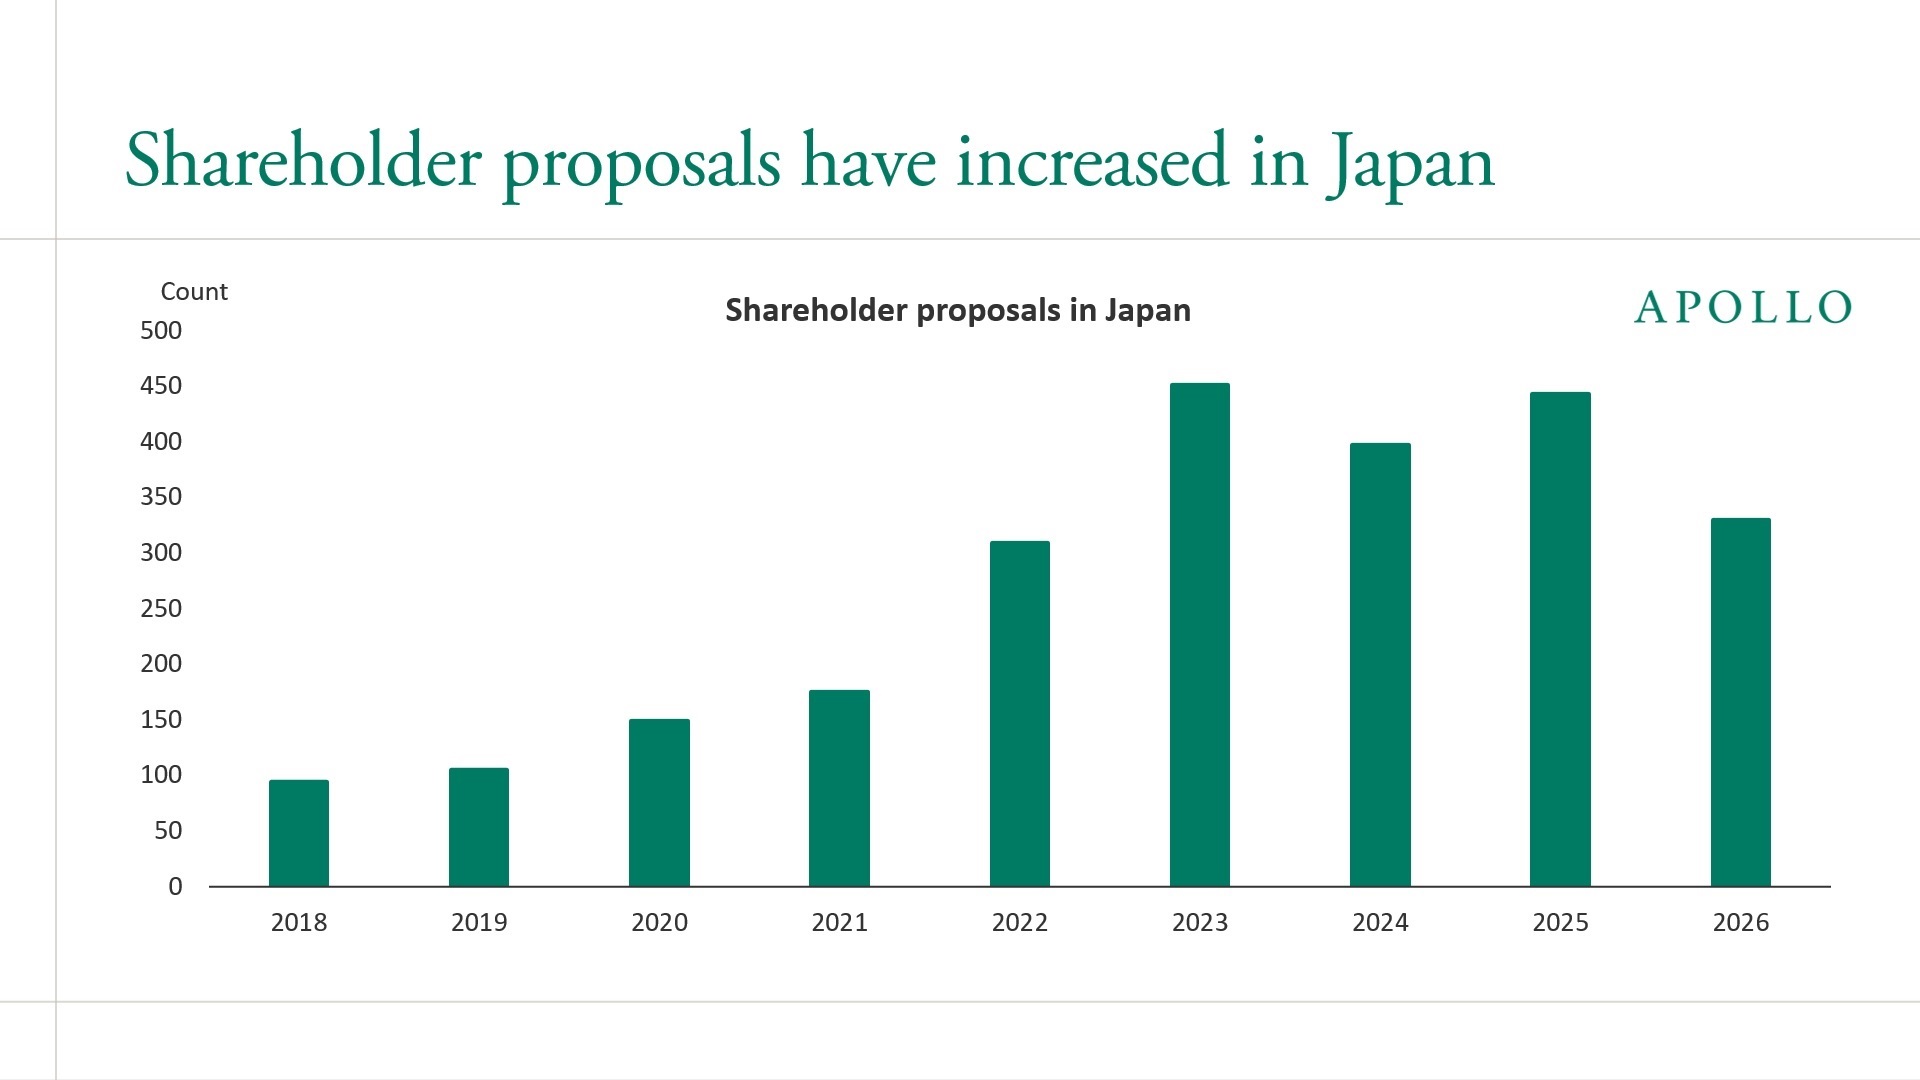
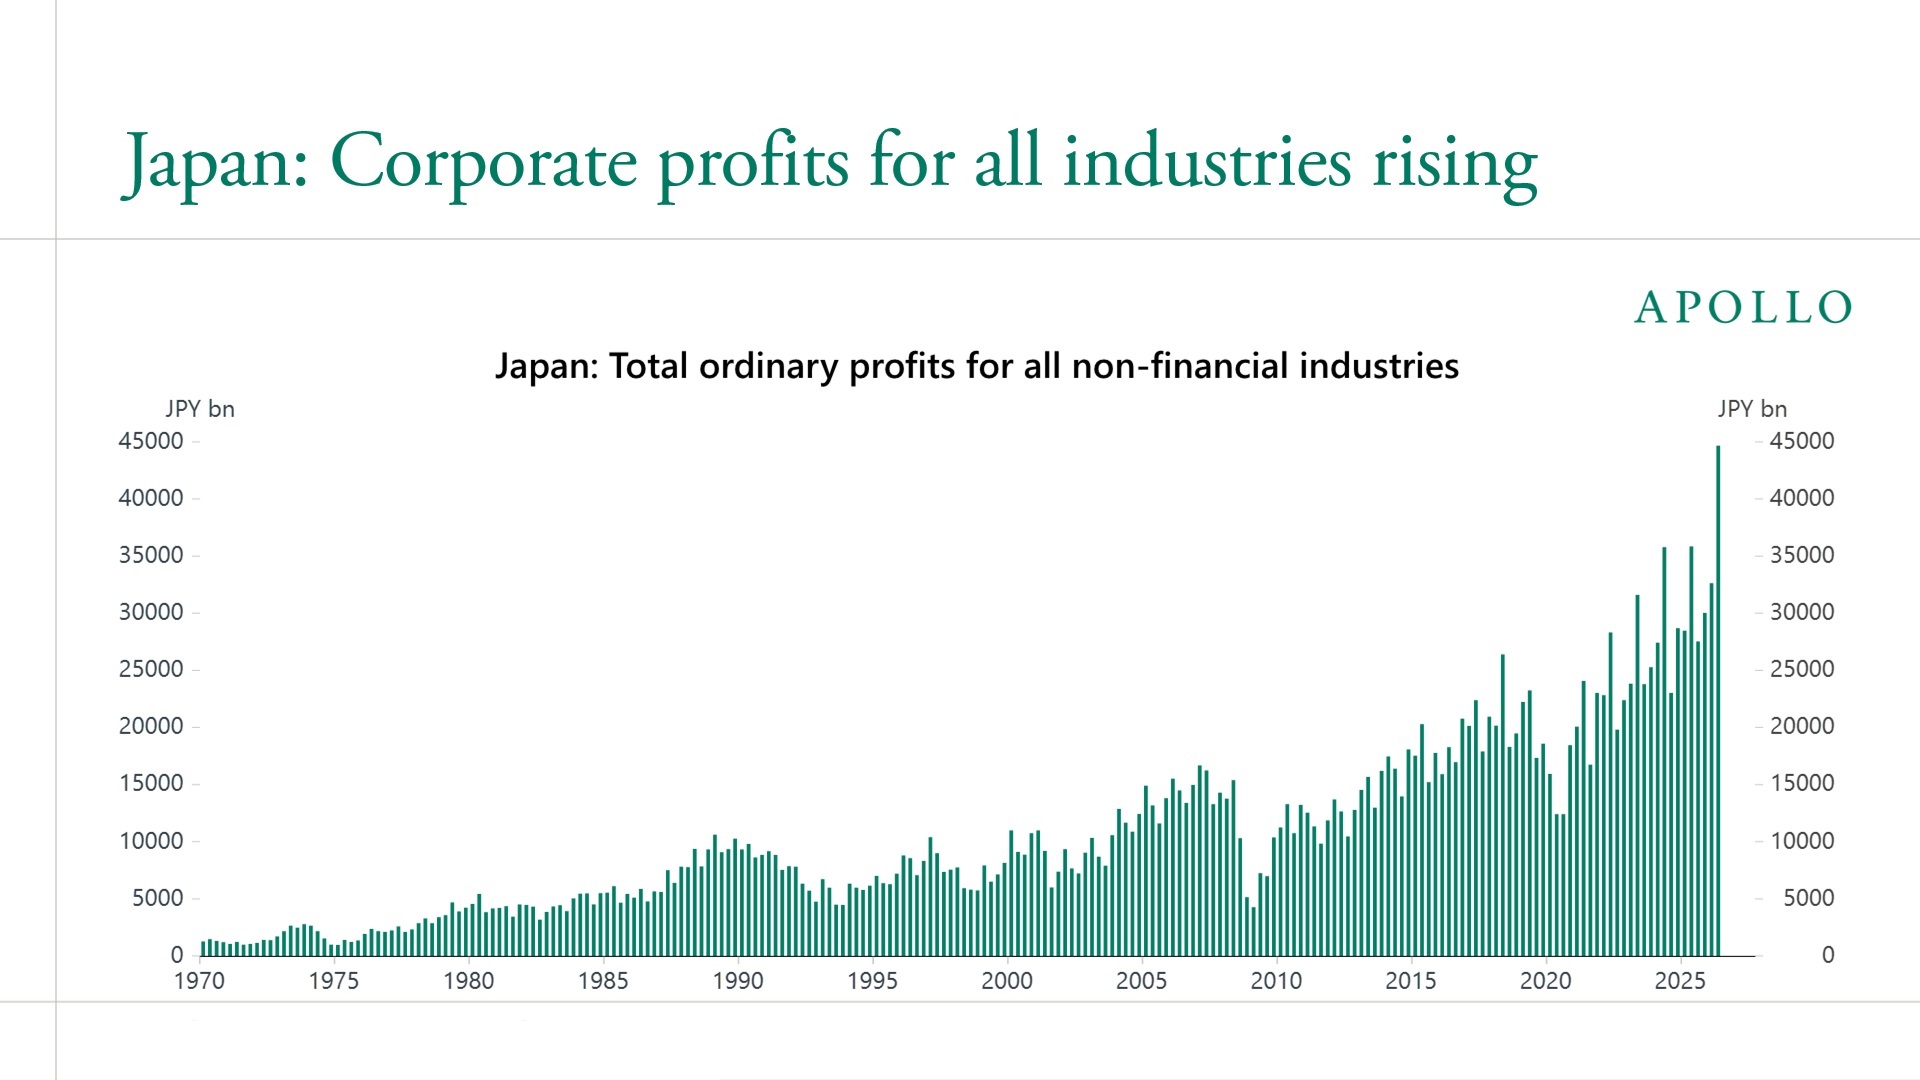
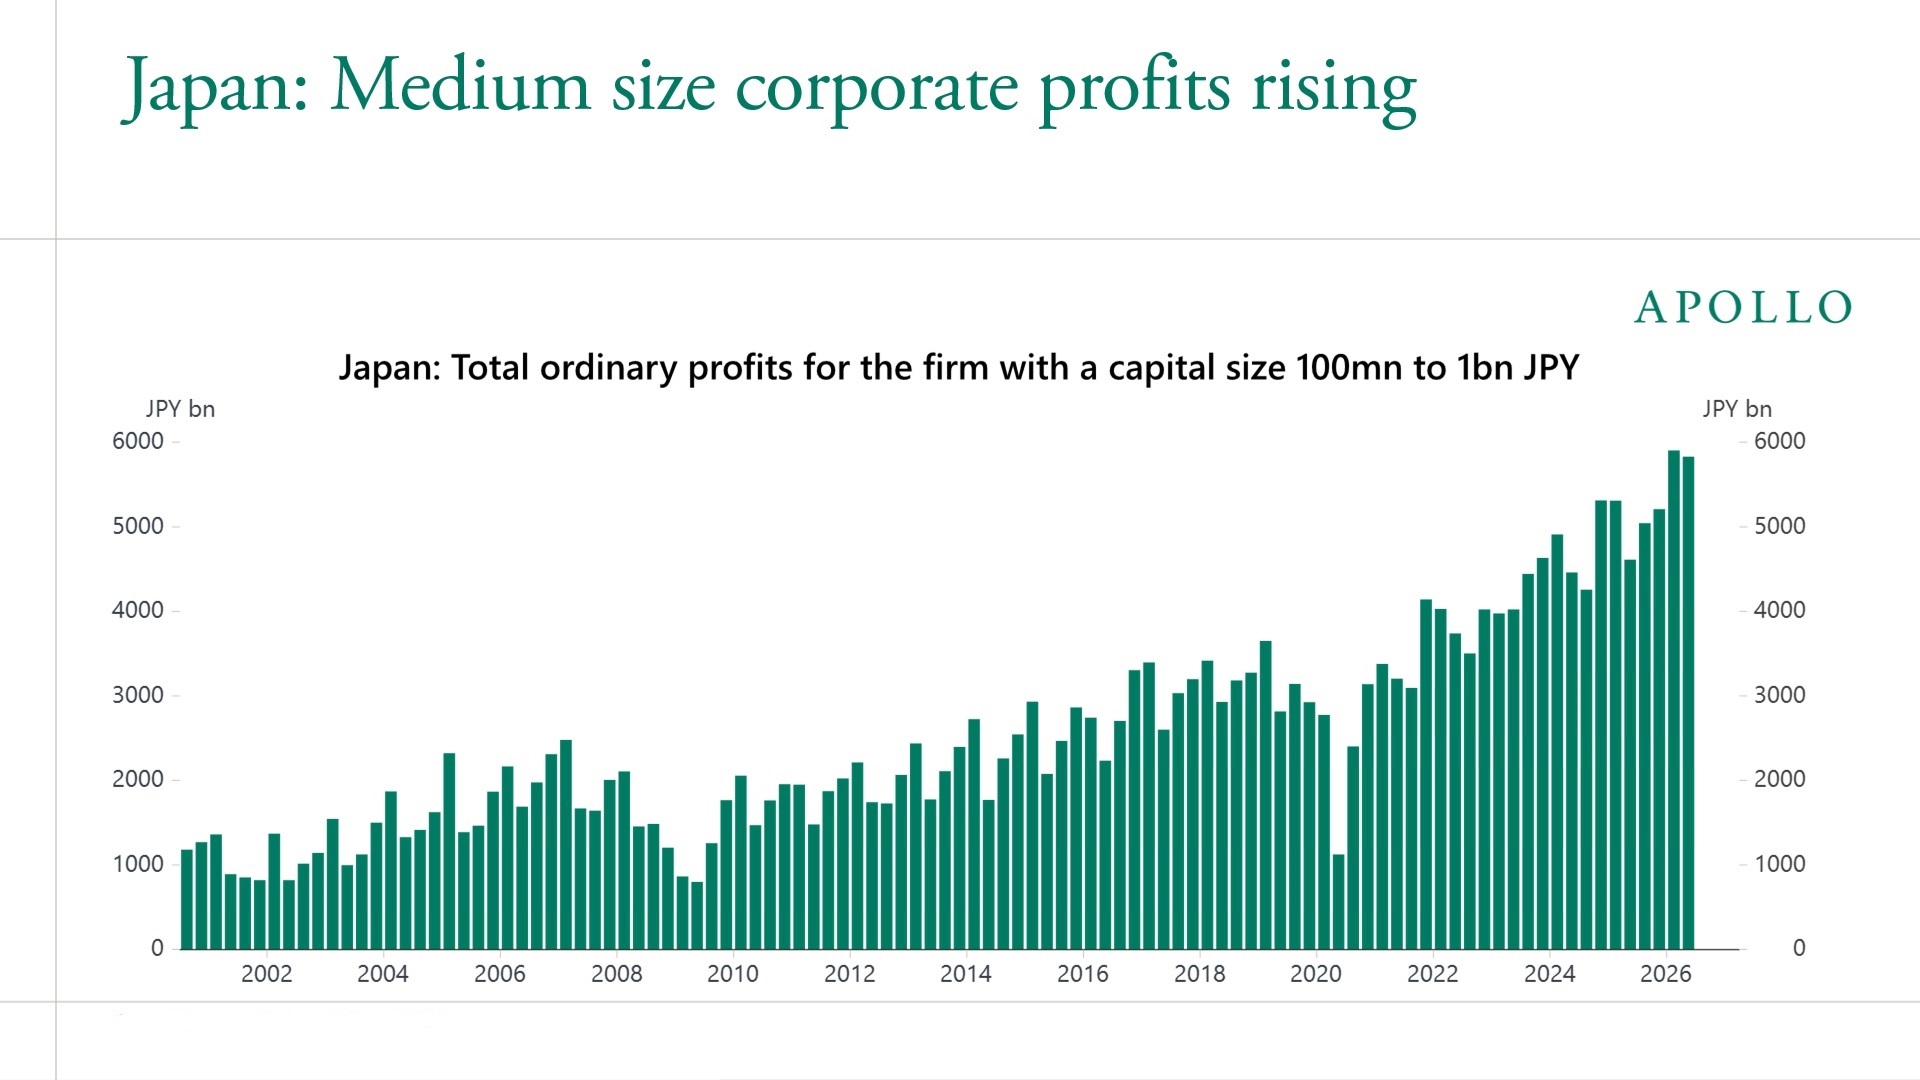
Japan Weeks (Oct. 26-30), now in its fourth year, brings global investors and asset managers together to explore the opportunities in Japan’s financial and capital markets. One of the most important themes behind that opportunity is shareholder activism, which is reshaping corporate Japan. Shareholder proposals have more than tripled since 2018, reflecting a stronger focus on governance and shareholder value, see first chart below. This is starting to translate into stronger corporate profits, with profits at Japan’s medium-sized businesses (those with capital of JPY 100 million to 1 billion) reaching historically high levels, a sign that improving profitability extends well beyond the country’s largest companies, see second and third charts.
Note: Shareholder proposals include Approve Name Change, Approve Statutory Auditor, Business Operations, Charter/Bylaw Amendment, Climate Change Risk, Decrease Authorized Stock, Director Compensation, Discharge Directors, Dividend/Profit Distribution, Elect Director, Extend Poison Pill (Shareholder Rights Plan), Methane/Greenhouse Gas Emissions, Other Auditor Related, Other Board Related, Other Capital Structure, Other Compensation, Other Governance, Remove Director, Remove Poison Pill (Shareholder Rights Plan) and Share Repurchase Related proposals. Sources: Bloomberg, Apollo Chief Economist
Sources: Bloomberg, Macrobond, Apollo Chief Economist
See important disclaimers at the bottom of the page.
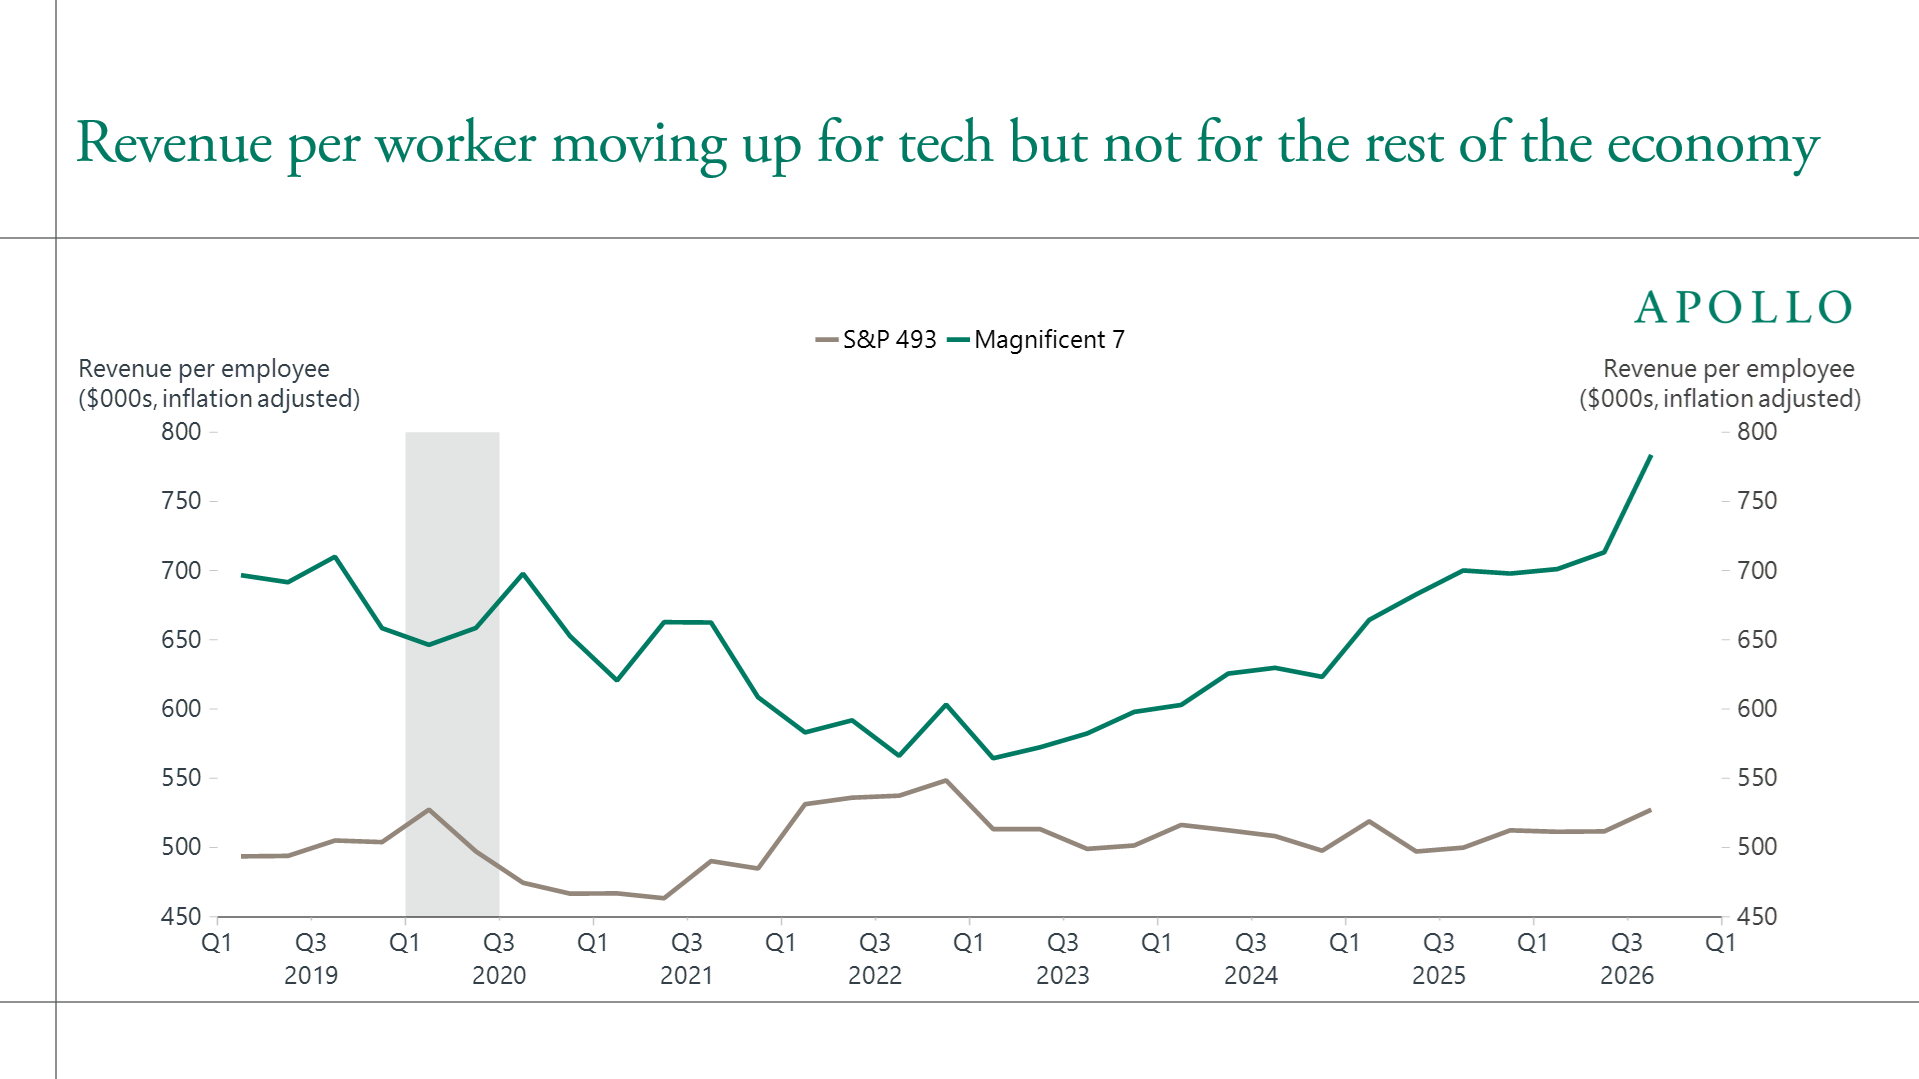
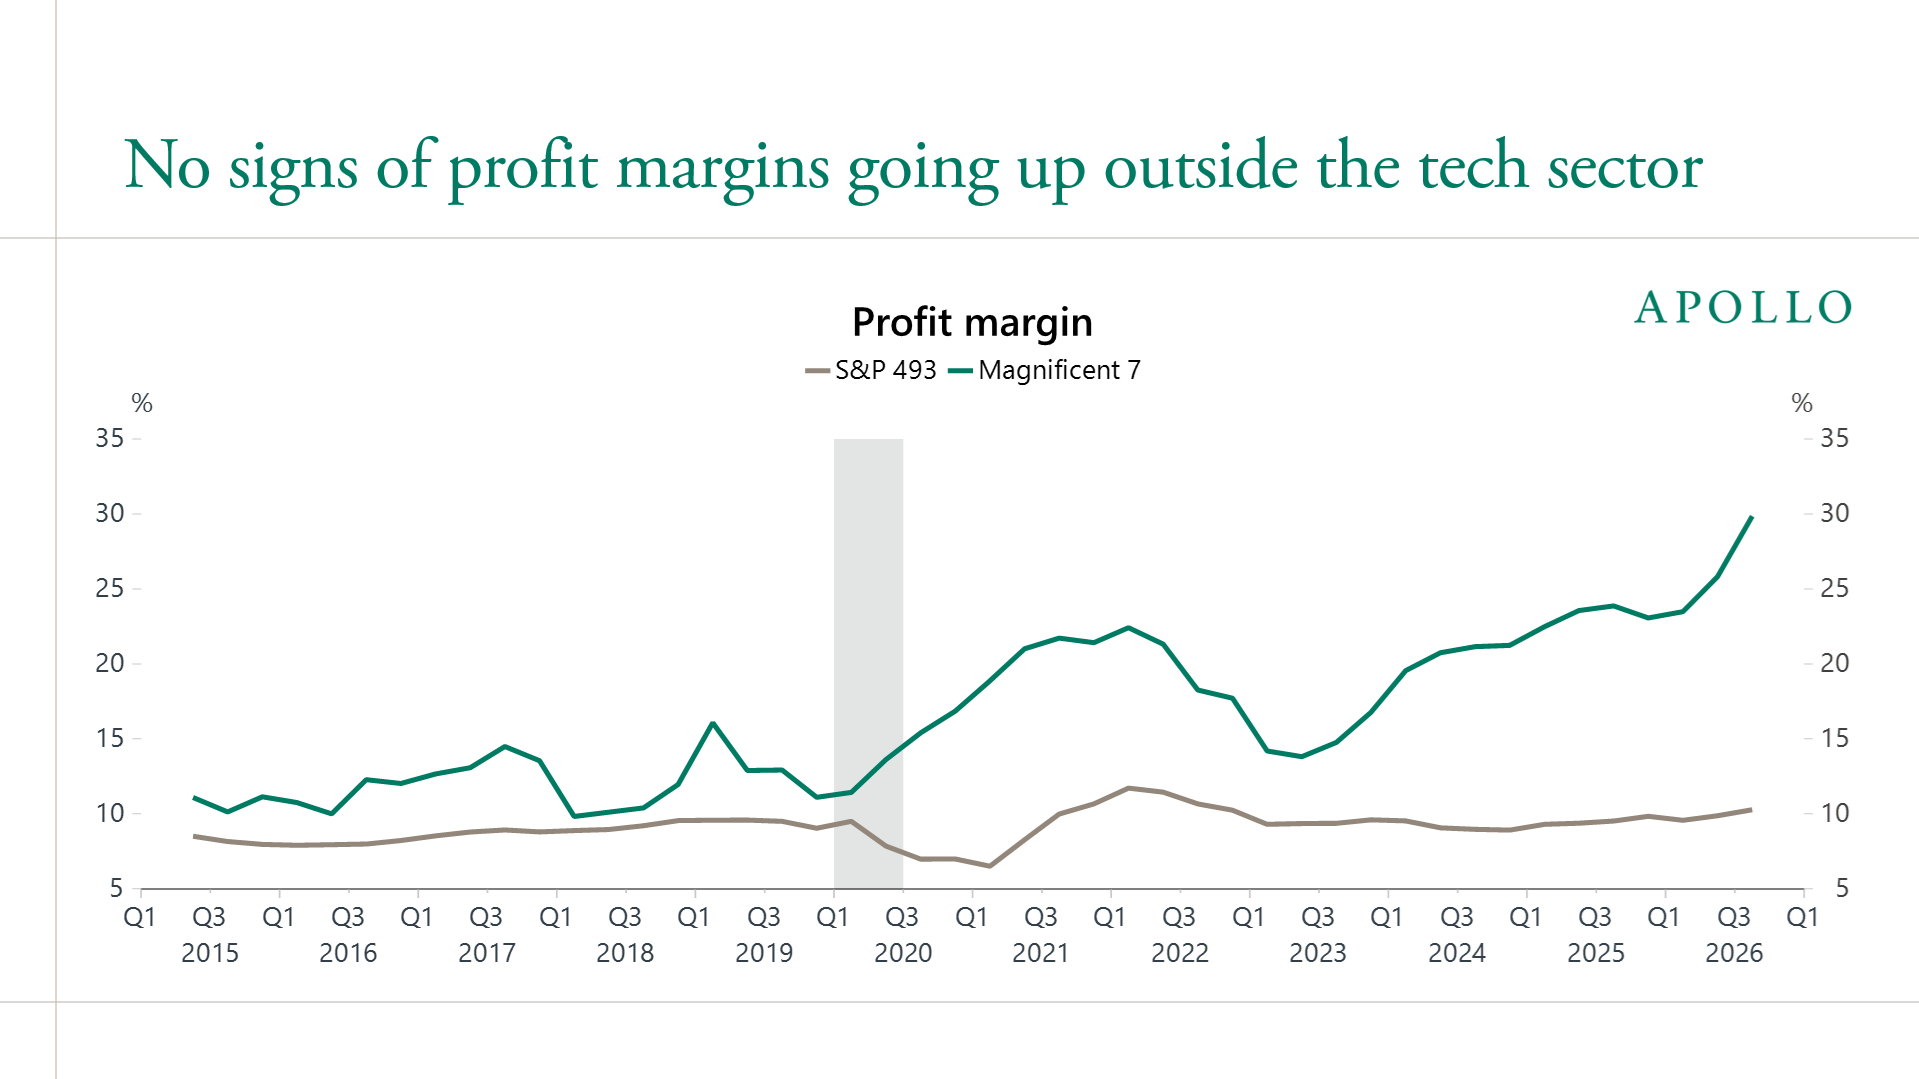
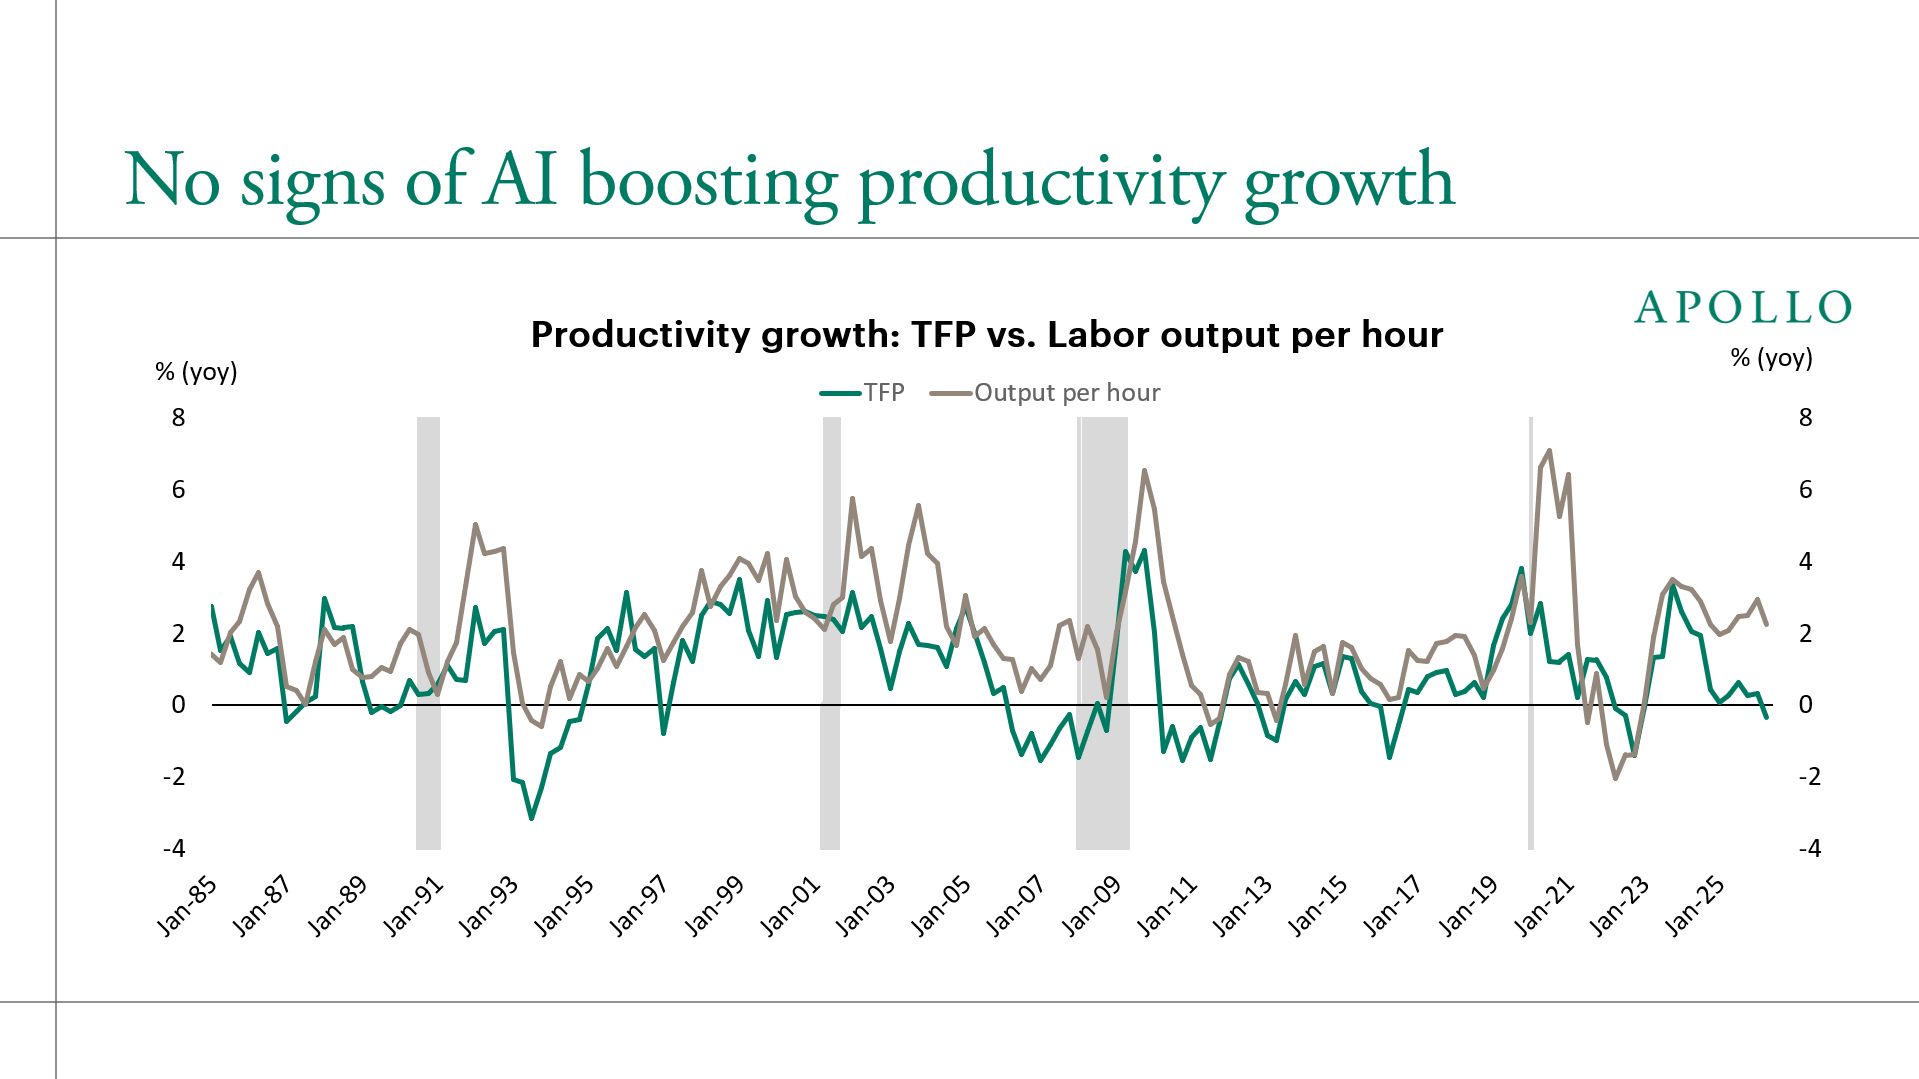
Despite massive investments and widespread hype around artificial intelligence, the technology has delivered zero financial payoff to corporate America outside of tech. Revenue per worker is rising for the Mag 7 but is flat for the S&P 493, see the first chart below. Profit margins are rising for the Mag 7 but are flat for the S&P 493, see the second chart below. And there are still no signs of AI boosting productivity growth, see the third chart below. With no impact on the bottom line, mainstream corporate America is pulling back and starting to view token spending not as a source of growth but as a cost center that weighs on margins.
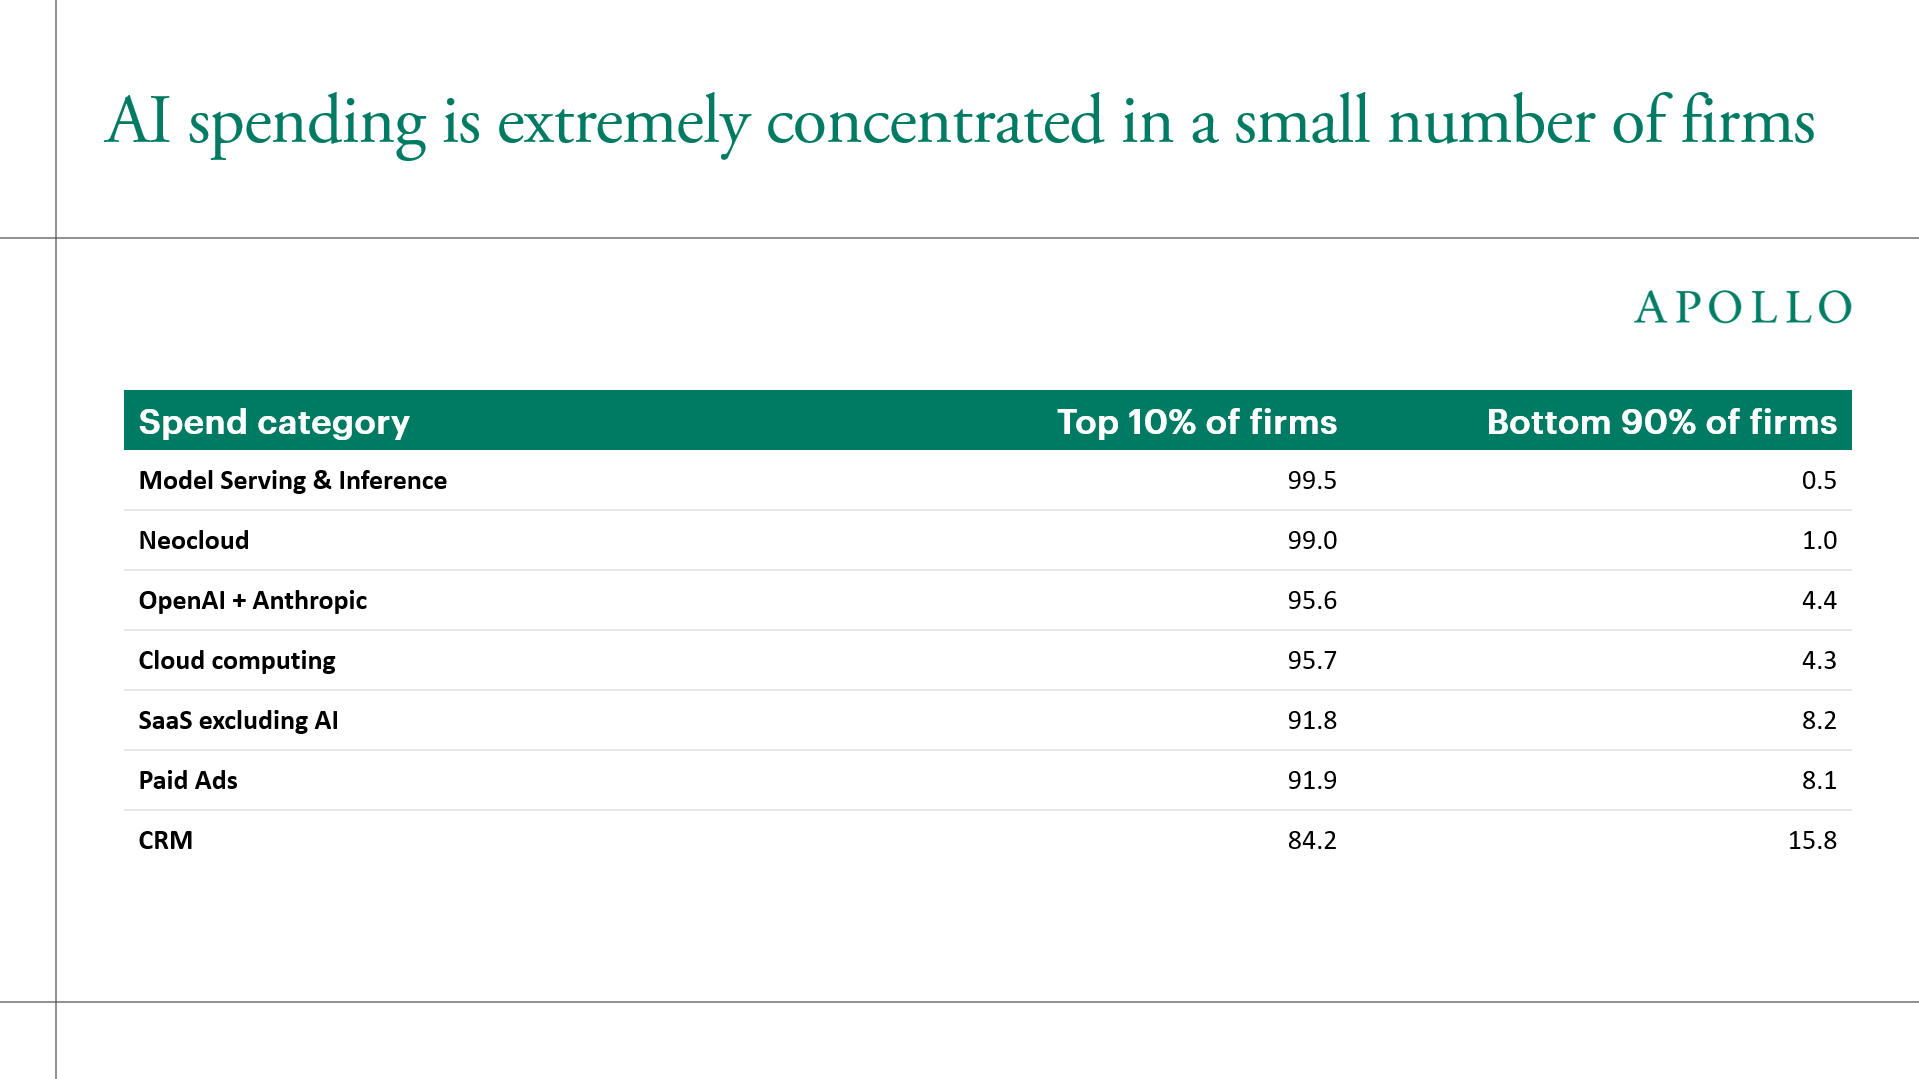
VC-backed companies are spending more and more on tokens, but mainstream corporate America does not need the latest model and is unwilling to pay for it. As long as agentic AI and token spending are confined to a small part of the economy, the macroeconomic effects of AI will be very limited, see the fourth and fifth charts below.
The question looking ahead is whether, even as models become commoditized, mainstream corporate America can turn increasingly cheap intelligence into higher revenue growth and higher profit margins. That may be harder than it sounds. AI may be a great calculator, but in business, intelligence is mostly judgment. Judgment depends on context, and the answer varies with which human or which model you ask. Perhaps most importantly, AI does not understand accountability, trust, culture, unwritten rules, ethical trade-offs or fairness, all of which shape reputational risk and ultimately drive revenue growth and profit margins.
The bottom line is that the AI story will be decided in the S&P 493, not the Mag 7, and so far, there is no evidence that revenue growth or margins are improving outside the tech sector.
Note: Inflation adjusted to 2019 Q4. Sources: Bloomberg, Macrobond, Apollo Chief Economist
Sources: Bloomberg, Macrobond, Apollo Chief Economist
Note: Total Factor Productivity (TFP) is the utilization-adjusted series from the San Francisco Fed (Fernald, 2014), adjusted for cyclical variation in factor utilization. Sources: Federal Reserve Bank of San Francisco, US Bureau of Labor Statistics, Apollo Chief Economist
Sources: Ara Kharazian, Chief Economist, Ramp; Apollo Chief Economist
Sources: Ramp AI Index, Apollo Chief Economist
See important disclaimers at the bottom of the page.
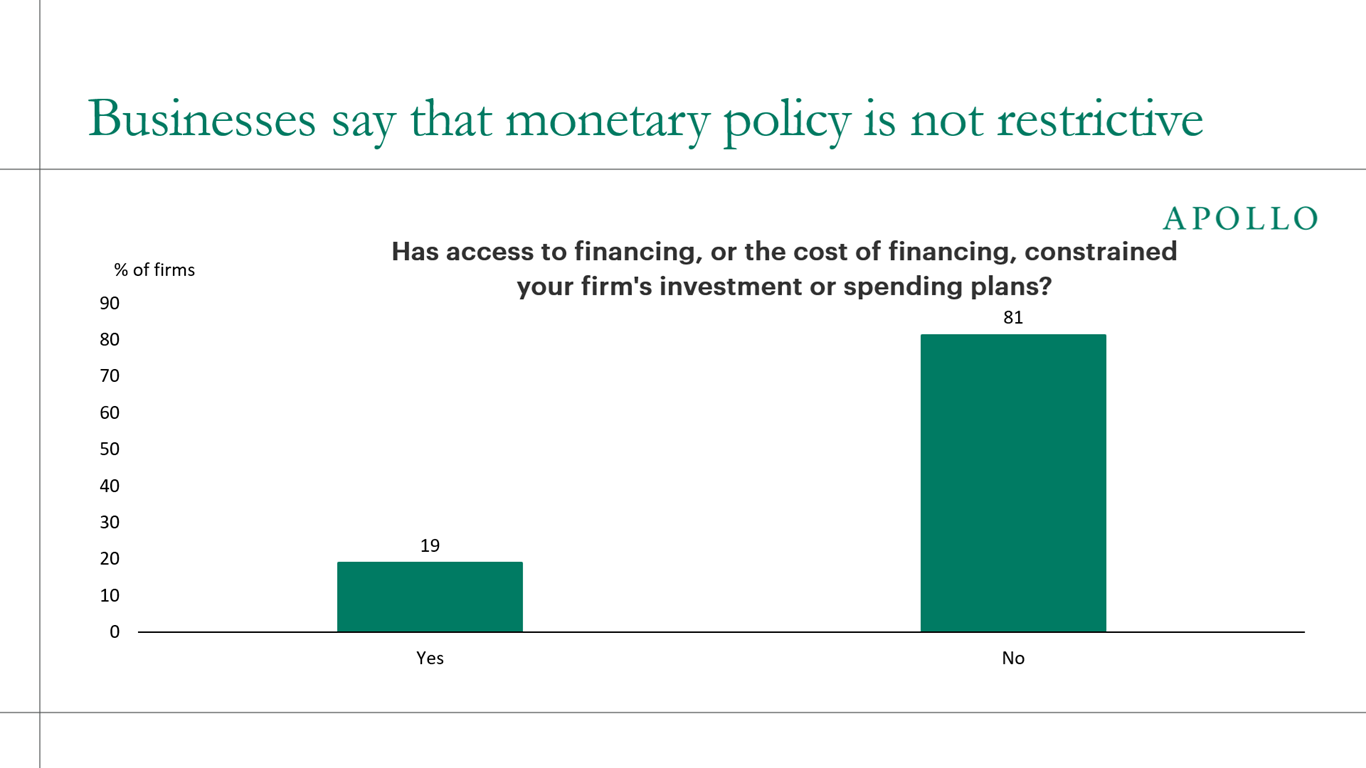
The Fed survey below for the third quarter of 2026 shows that only 19% of firms report that financing costs or access to credit are constraining their investment and spending plans, while 81% report no such constraints. The bottom line is that corporate America is saying that monetary policy is not restrictive.
Note: Data for 2026 Q3. Sources: CFO survey, Are Firms Financially Constrained? | Richmond Fed, Apollo Chief Economist
See important disclaimers at the bottom of the page.
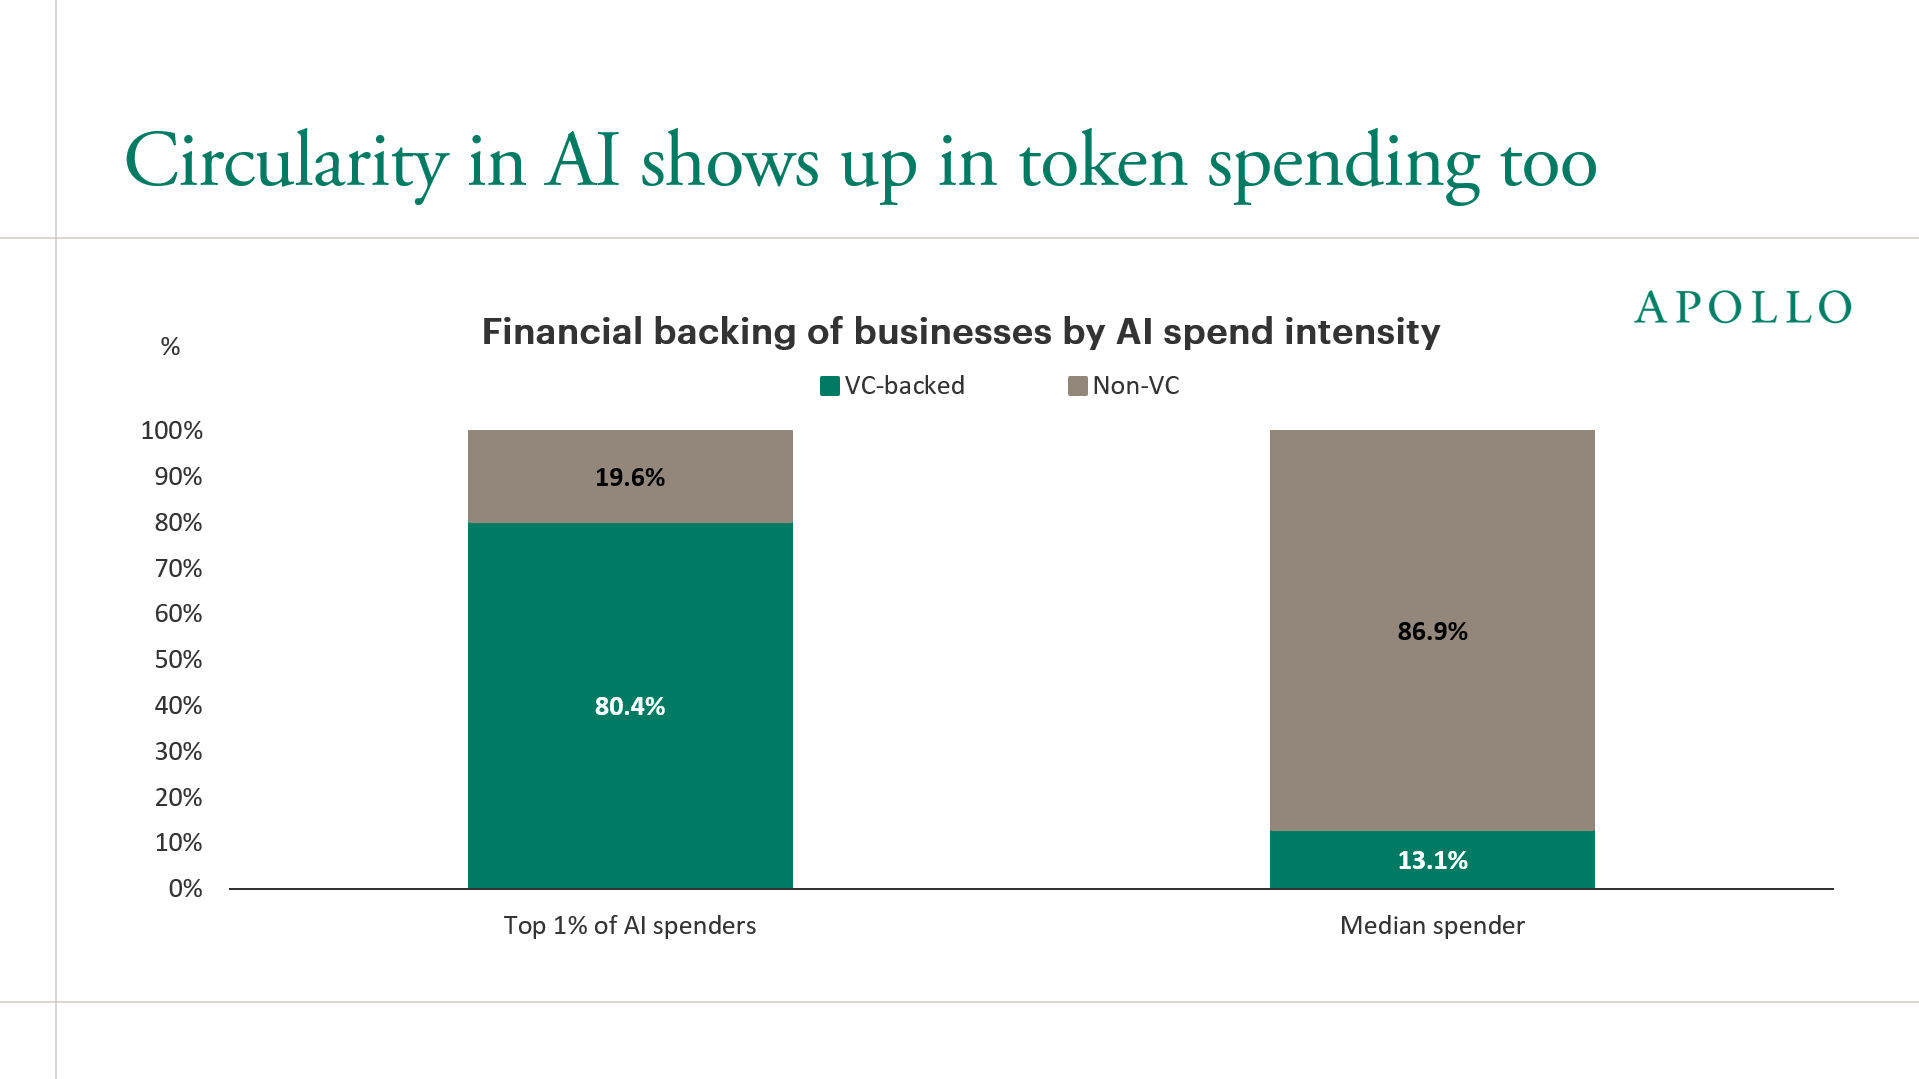
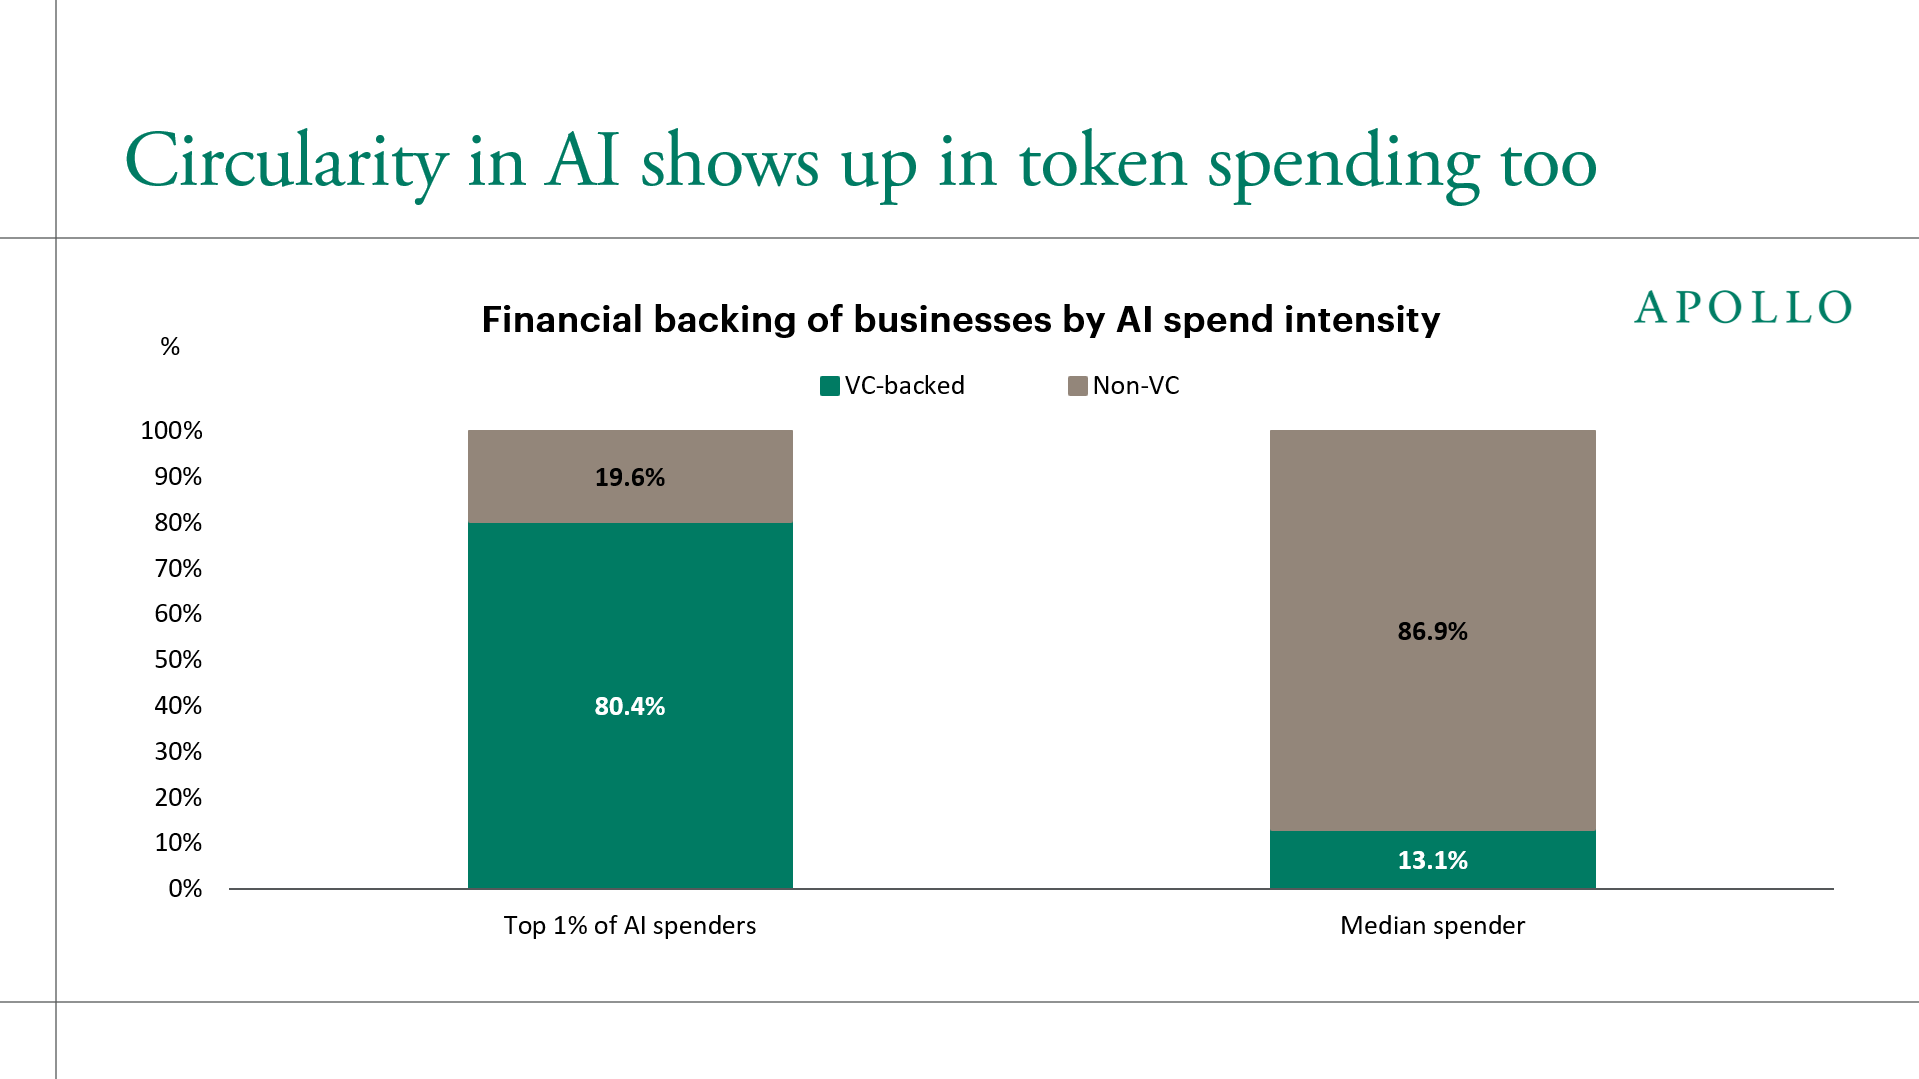
Ramp data show that 80% of the top 1% of AI spenders are VC-backed, compared with only 13% of the median spender, suggesting that the circularity seen among AI hyperscalers and model providers also extends to token spending, as the startups buying the most compute are paying for it with venture capital rather than organic earnings, see chart below.
If the AI payoff is slow to materialize or never arrives, VC returns would come under pressure, since the capital funding today’s token spending would have little to show for it, and a pullback in venture funding could in turn weaken demand for compute.
Sources: Ramp AI Index, Apollo Chief Economist
See important disclaimers at the bottom of the page.
October 21, 2026
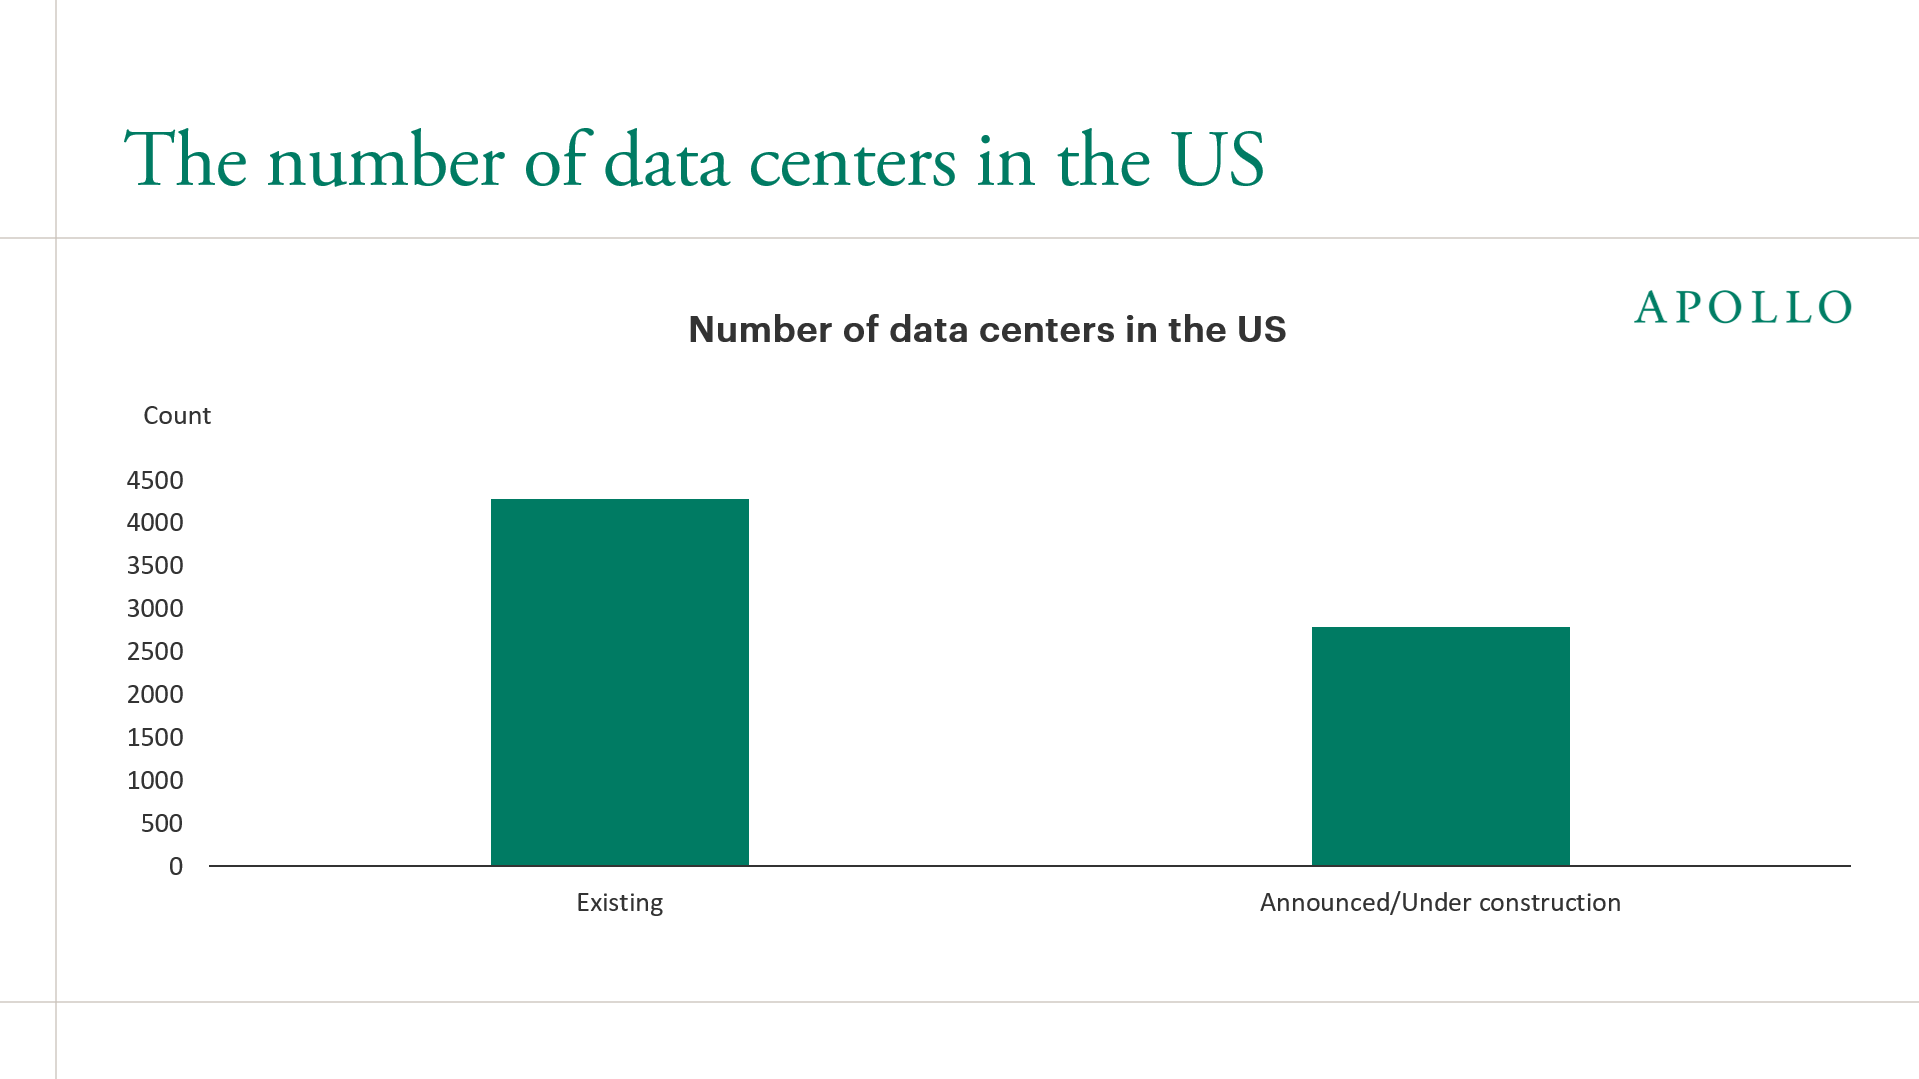
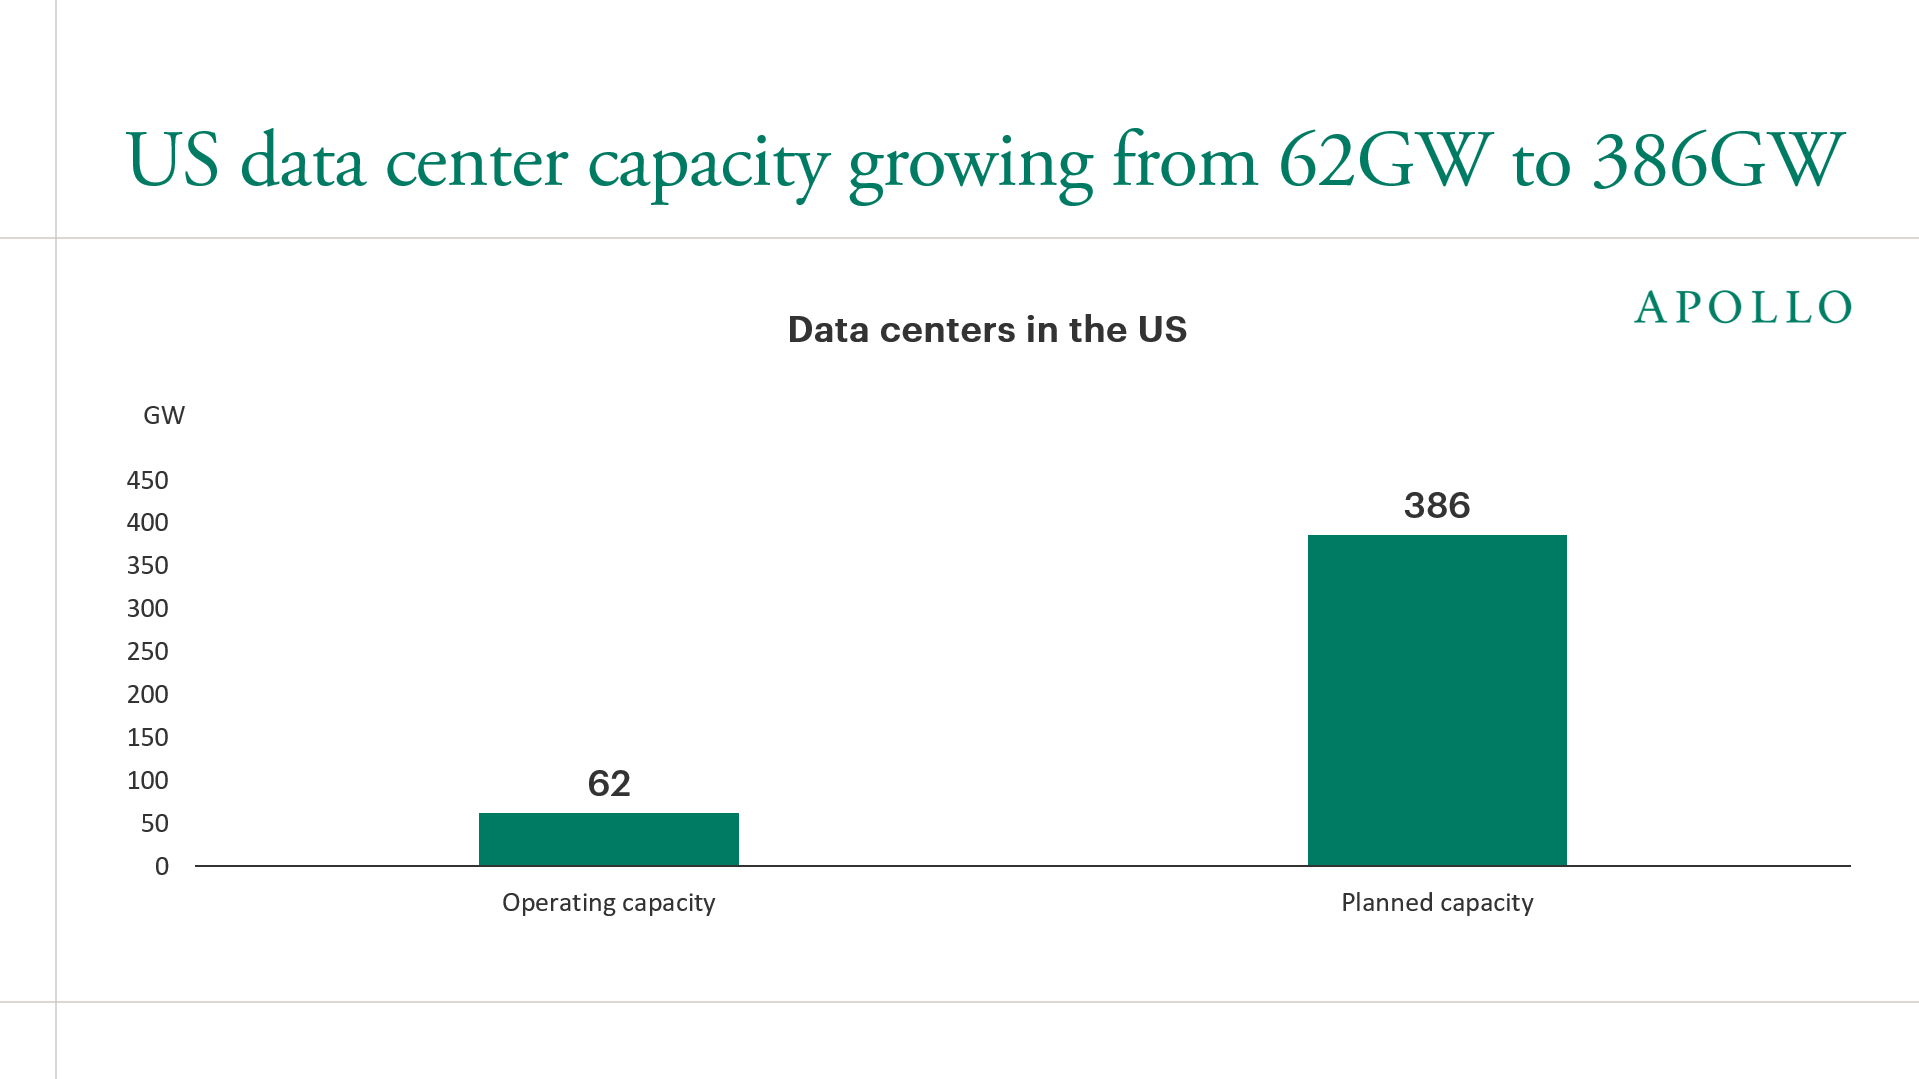
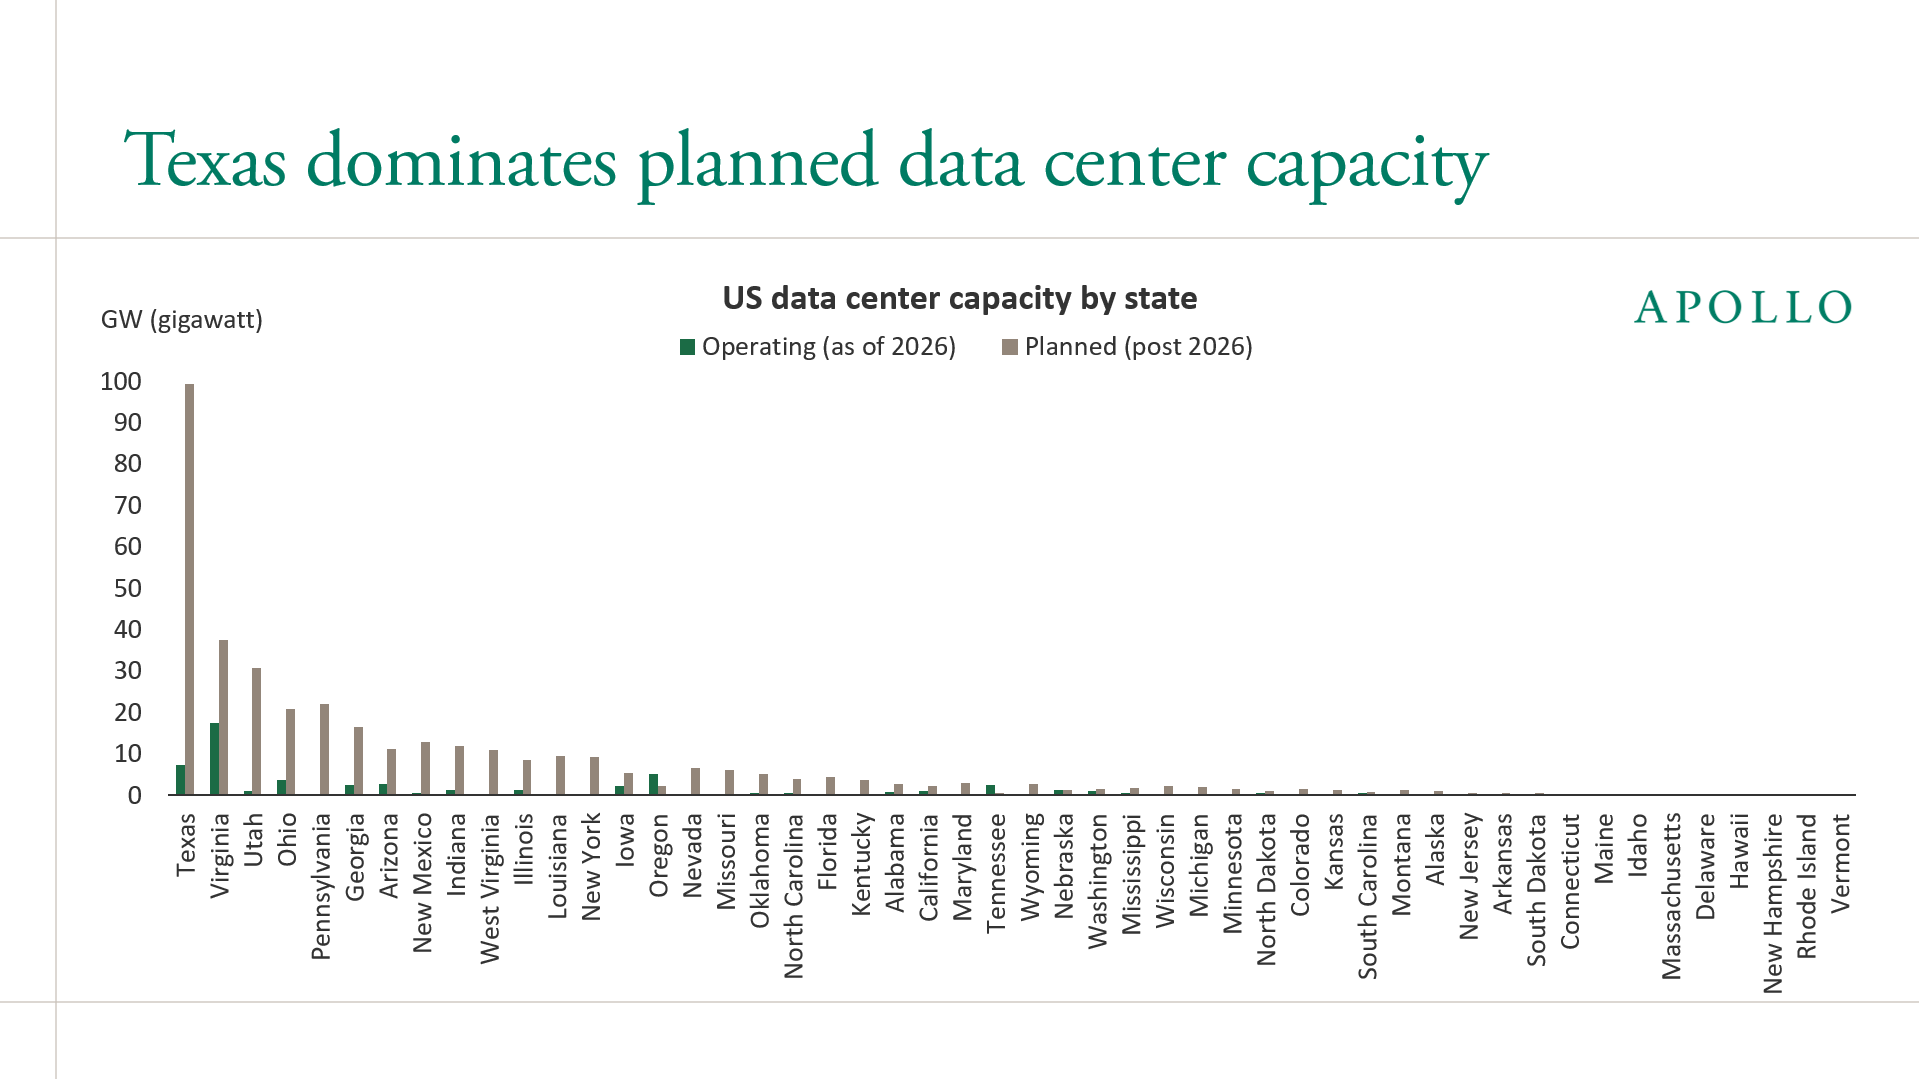
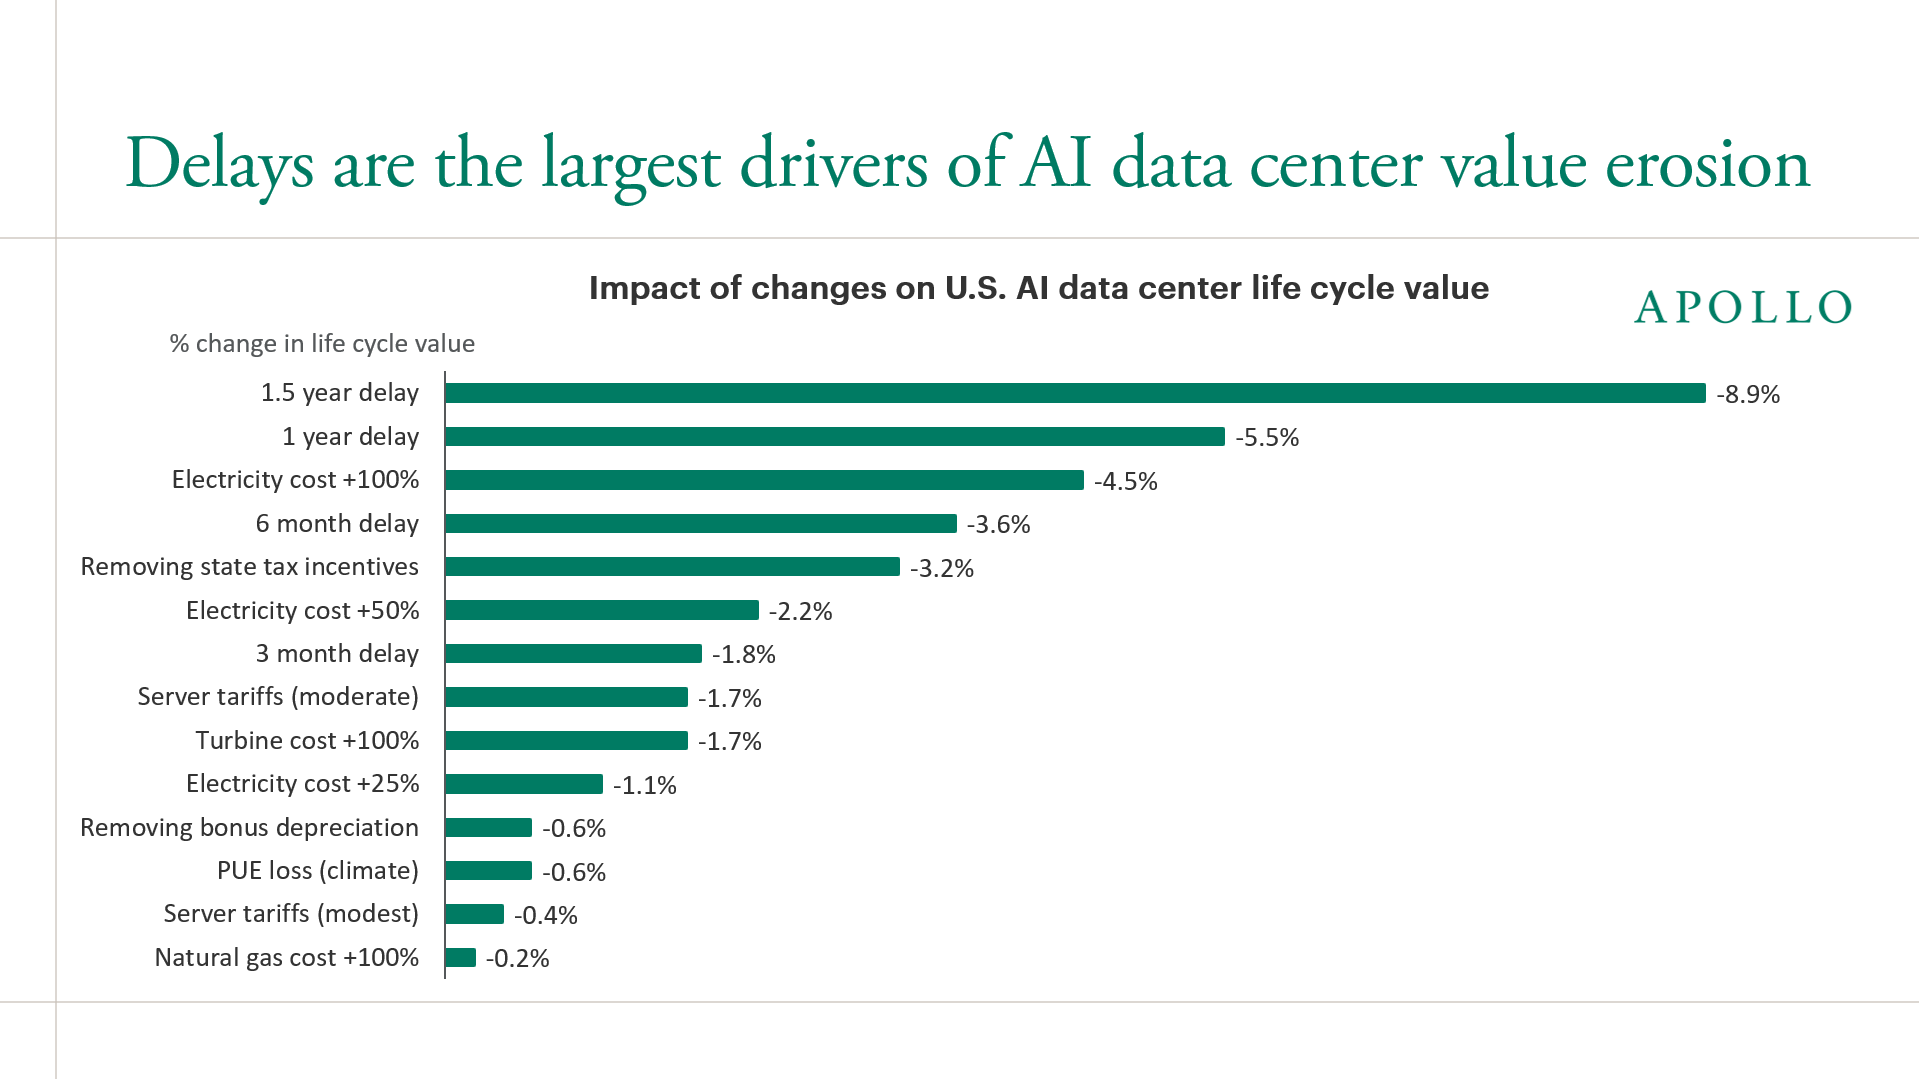
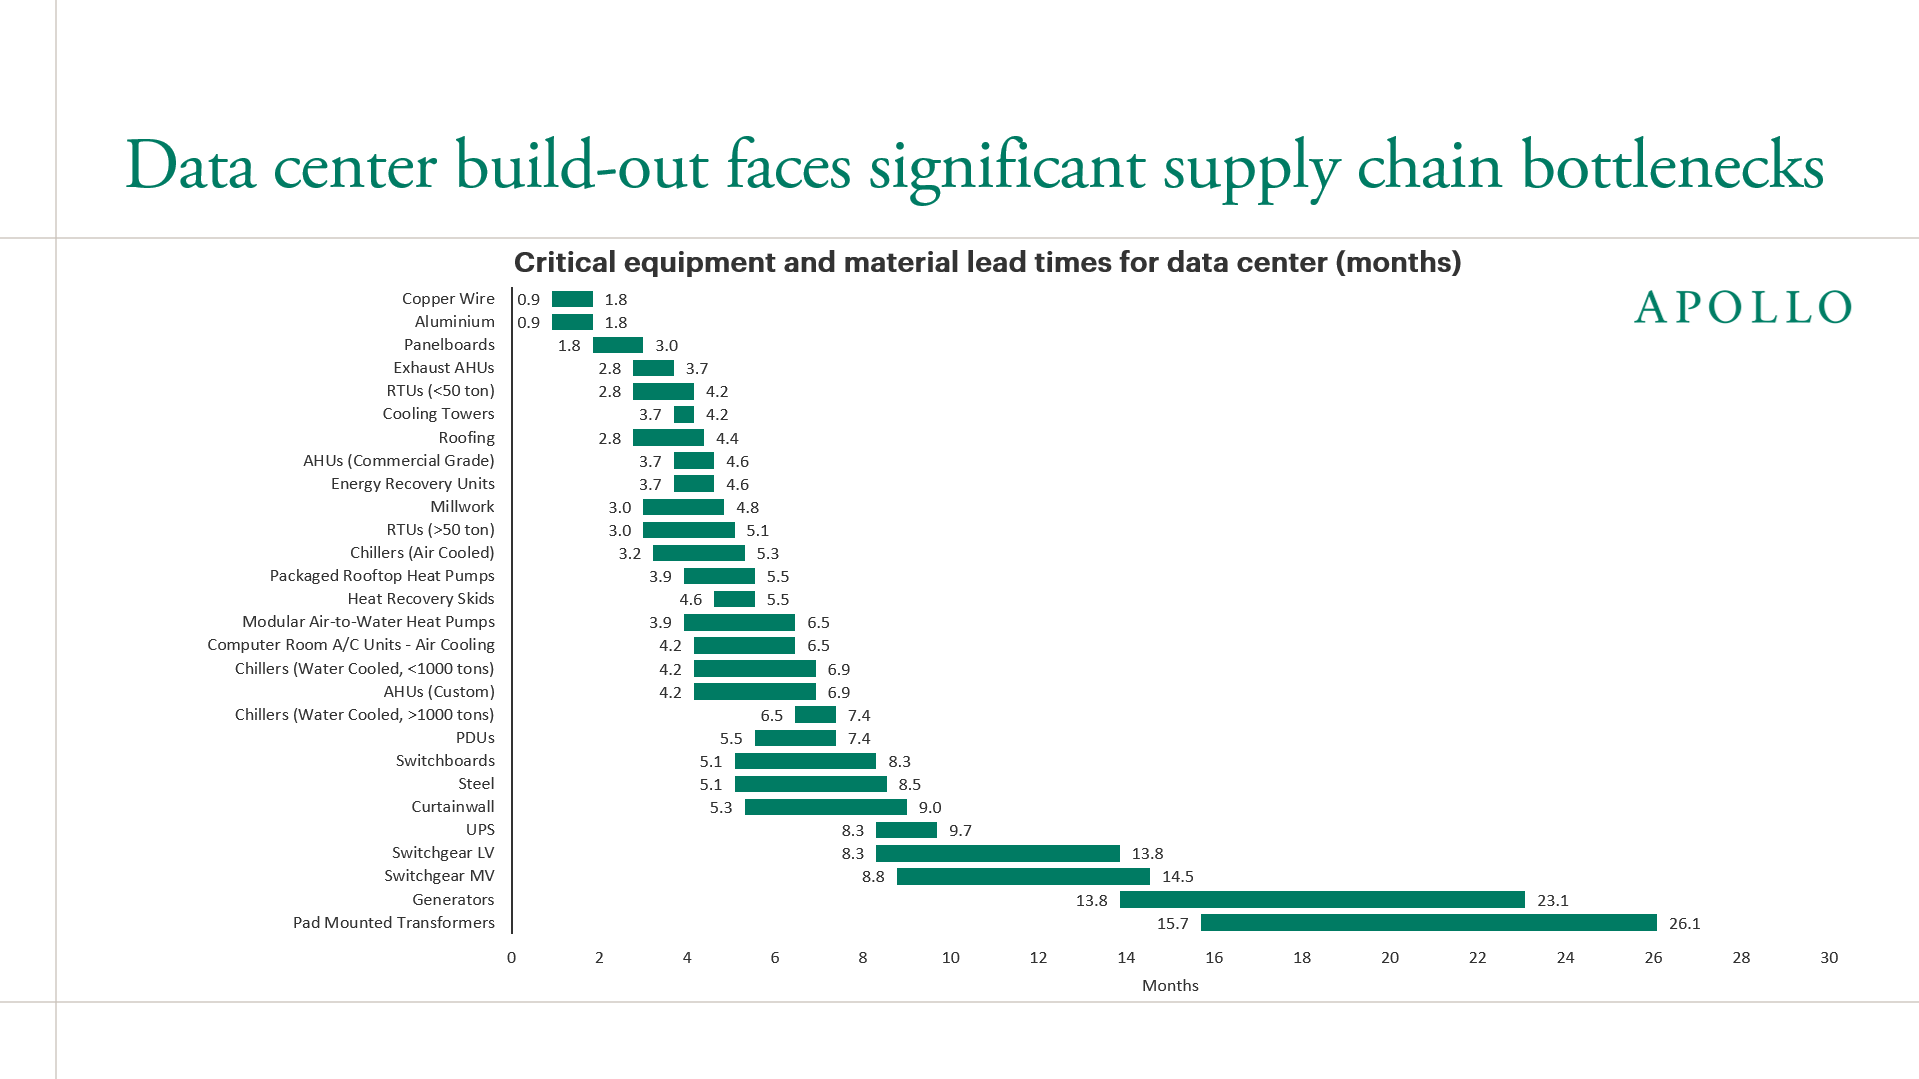
Compute demand is significantly greater than supply, so the speed of the data center buildout matters. Who are the winners and losers if the buildout takes longer?
Winners
Losers
For chipmakers, the outcome of a delay is more mixed. Chip demand stays strong, but if sites cannot energize fast enough, chip deliveries could outrun installation and delay revenue.
The key distinction for investors is delay versus cancellation. A delay hurts returns by pushing cash flows out, but the asset remains and may become more valuable. The real risk is that scarcity unwinds, for example, if supply catches up in a rush or demand softens, which would erode the premium on existing capacity.
The bottom line for investors is that a delay would favor assets tied to scarce physical capacity, such as operating data centers, power producers and long-lead equipment makers, while assets priced on on-time delivery would underperform, notably AI-linked equities with high multiples and the debt of leveraged developers. Chipmakers face mainly timing risk, and hyperscaler bonds face mostly spread risk rather than default risk. The broader market would be exposed through the weight of AI names in major indices and through slower growth.
Sources: Americas-AI-Surge-Powering-Growth-in-Every-State.pdf, Data Centers – Database, Apollo Chief Economist
Sources: US Data Center Map — Project List & Tracker, Cleanview, Apollo Chief Economist
Sources: Cleanview, Apollo Chief Economist
Note: 100MW hyperscaler greenfield AI-optimized data center, 12-year life cycle plus terminal value, GB200 NVL 72, financed by internal free cash flow. Average of grid interconnect and behind-the-meter "bridge" scenarios. Sources: Carnegie Endowment International AI Data Center Model, Apollo Chief Economist
Sources: Cushman & Wakefield (Data Center Construction Cost Guide 2026), Apollo Chief Economist
See important disclaimers at the bottom of the page.
October 20, 2026
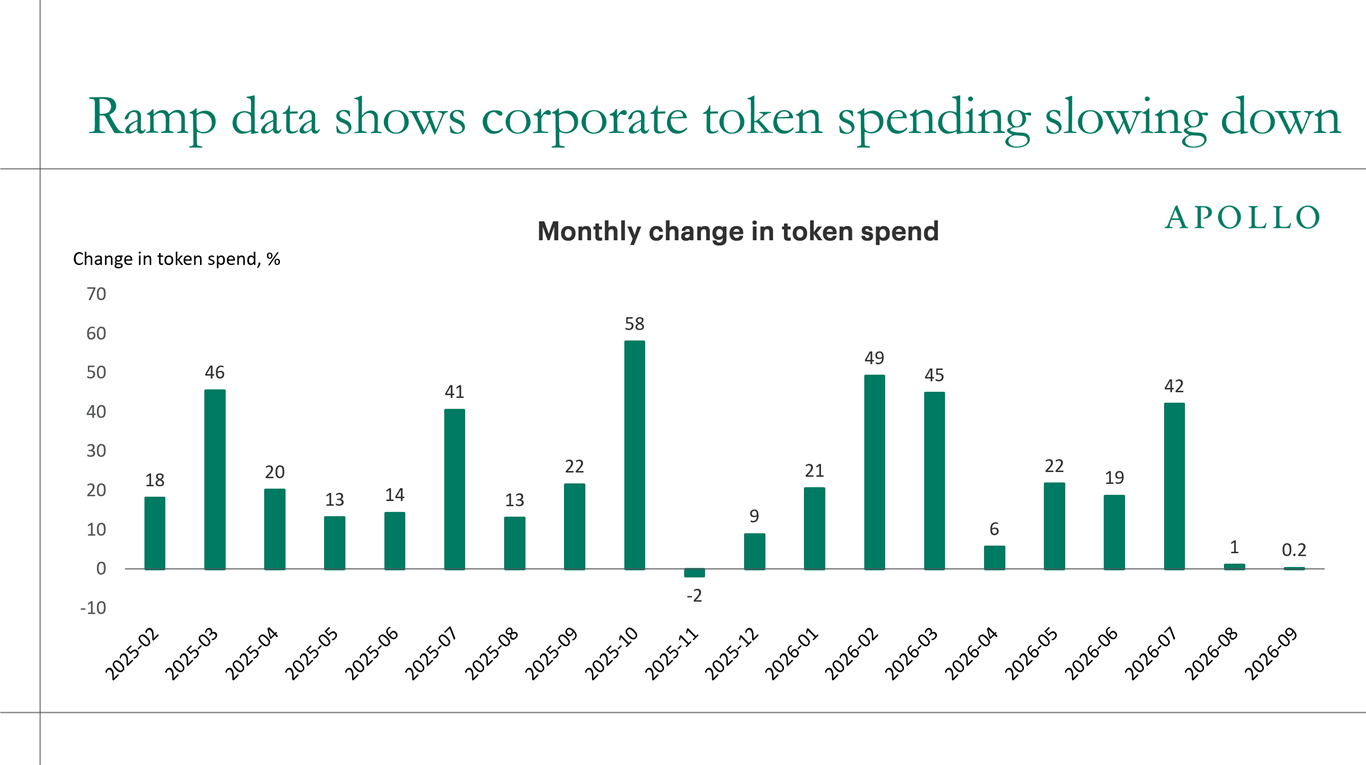
Silicon Valley operates on the premise that compute demand is unlimited, yet the recent slowdown in token spending growth suggests that this appetite may exist only when compute is effectively free, see first chart below.
In reality, compute appears to face a flat, highly price-sensitive demand curve, where even modest changes in token prices can drive buyers to throttle usage or substitute cheap open-source alternatives.
Silicon Valley’s conviction of infinite demand for compute collapses because it fundamentally ignores price, as productivity returns for firms on their AI investments are either arriving far slower than projected or failing to materialize at all, turning what was pitched as an essential growth engine into a margin-draining cost center.
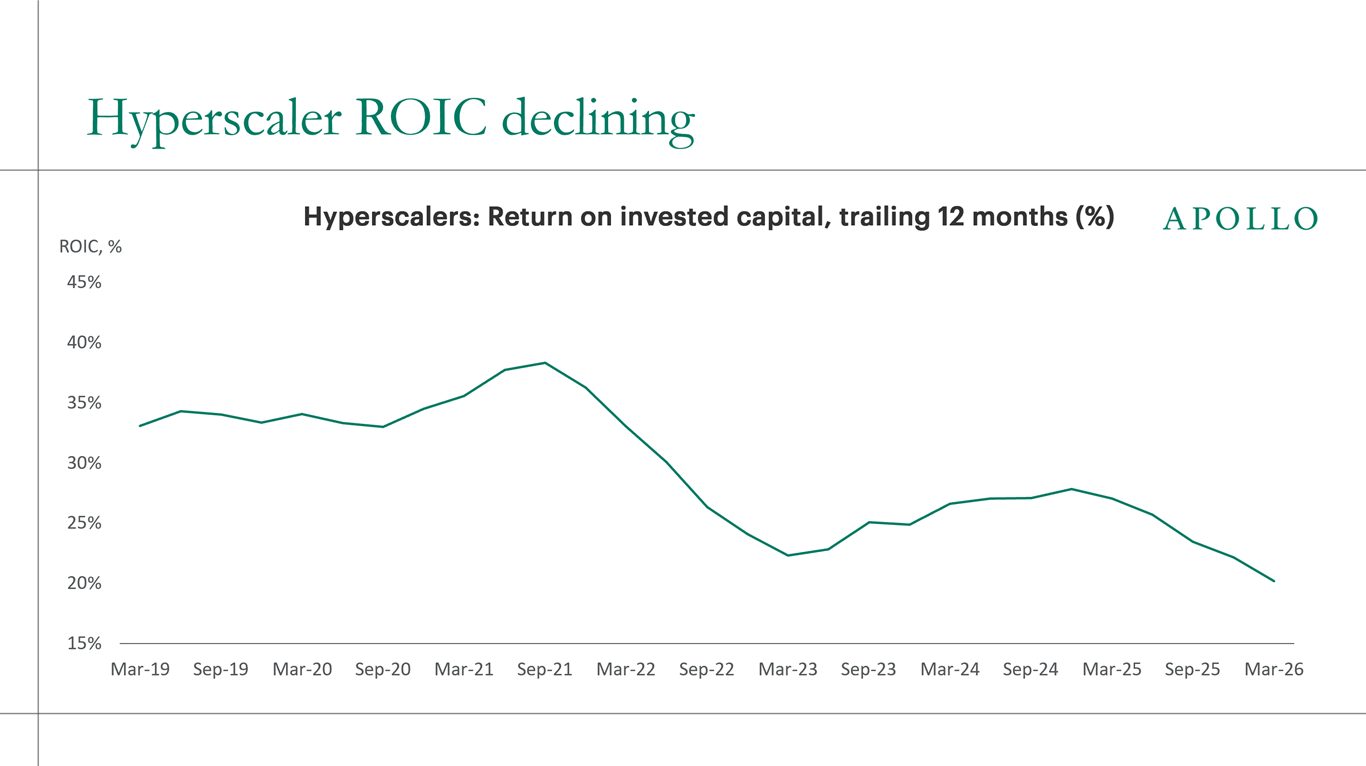
The squeeze is showing up on the supply side too. Return on invested capital for the five largest hyperscalers is declining, as invested capital grows faster than the earnings it generates, see second chart below.
The core economic flaw in the AI bull case is that the marginal cost of producing compute exceeds the marginal benefit it delivers to users, raising questions about claims of unlimited demand for data centers. How much compute and how many data centers are needed depends on the returns firms are able to generate with that compute. So far, the AI payoff for firms has been slow to materialize, implying a growing reluctance to pay for AI services. That is consistent with the ongoing slowdown in token spending among corporate customers.
Ultimately, the number-one variable governing the viability of data center construction models is not physical capacity or power; it is the actual price users are willing to pay for the compute being built, and companies will only pay a high price for that compute if they are able to turn the compute into higher top-line growth, bigger profit margins or substantial cost savings, little of which is showing up at scale yet. Maybe that will come in the future. Maybe not.
Sources: Ramp Al Index, Apollo Chief Economist
Note: Hyperscalers include Amazon, Google, Meta, Microsoft, Oracle. ROIC = trailing-12-month (EBIT − taxes) / (equity + debt − cash & short-term investments). Sources: Bloomberg, Apollo Chief Economist
See important disclaimers at the bottom of the page.
October 19, 2026
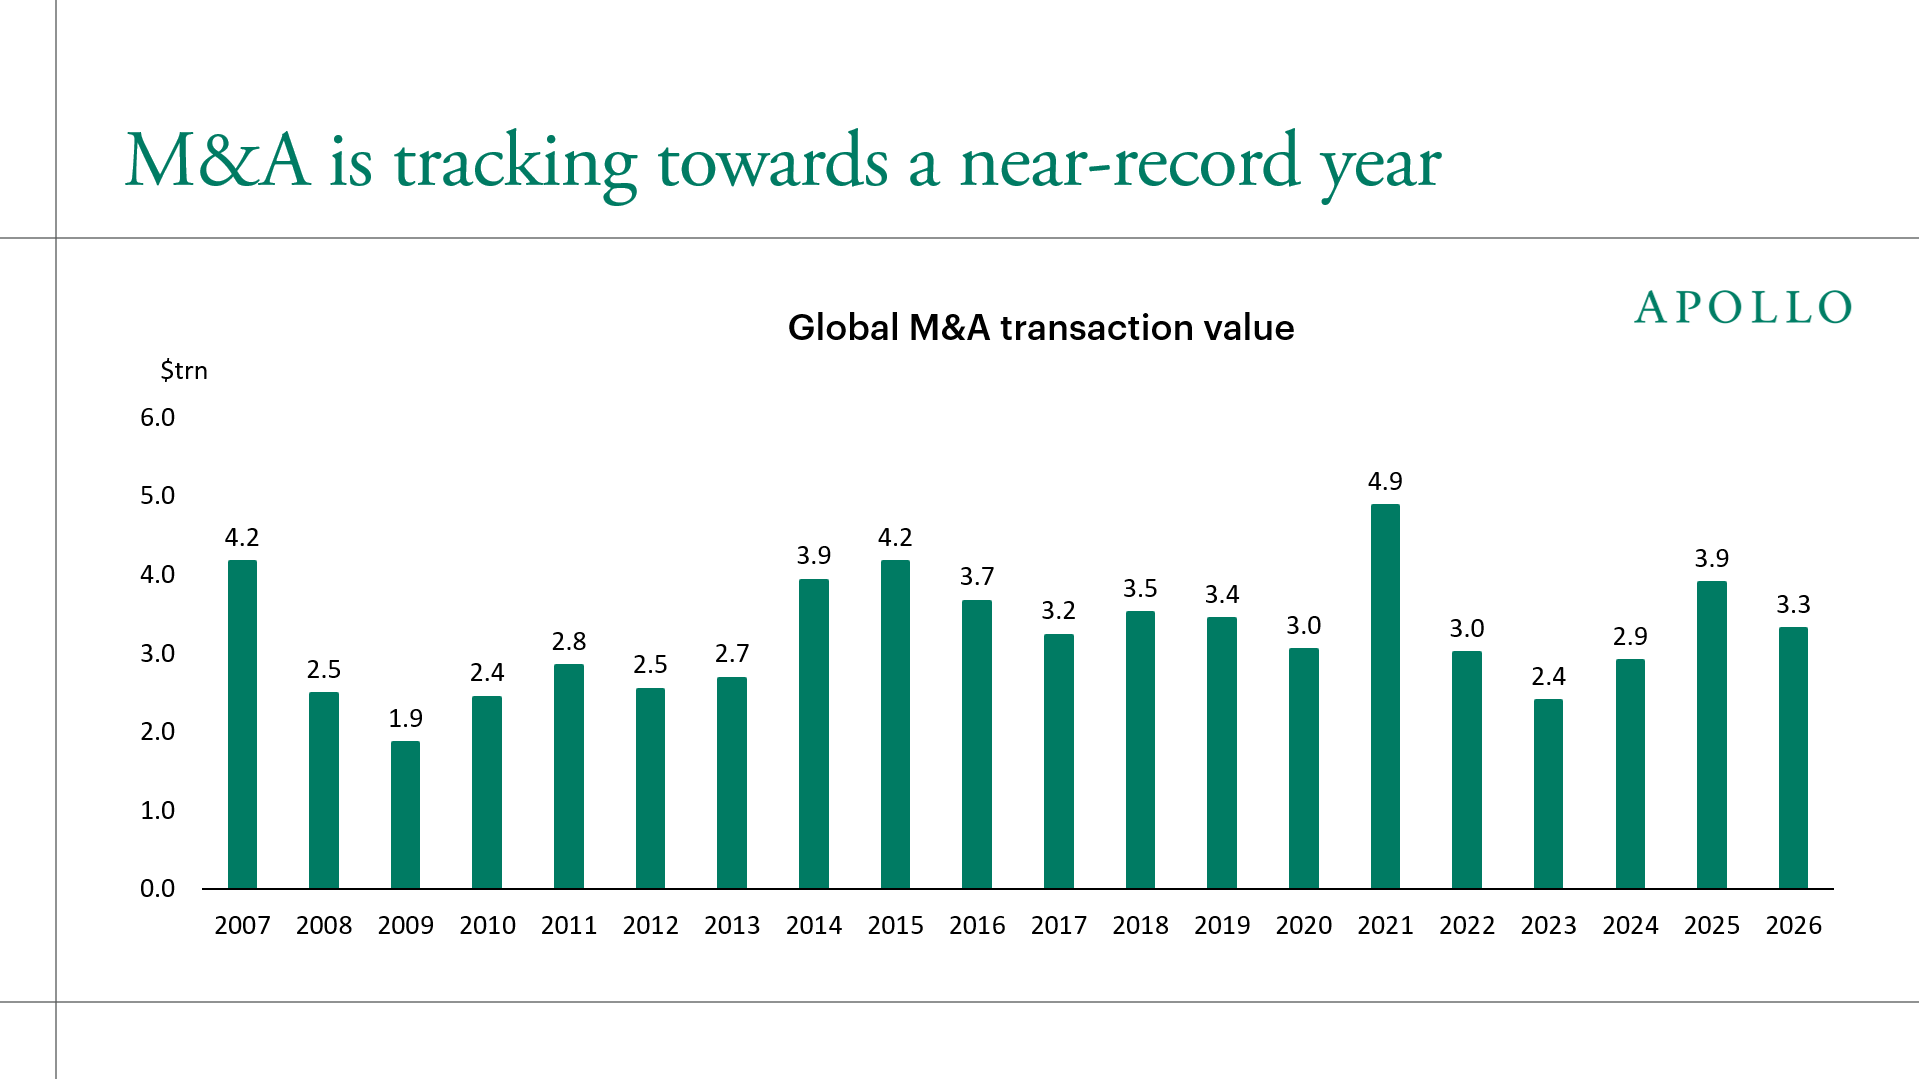
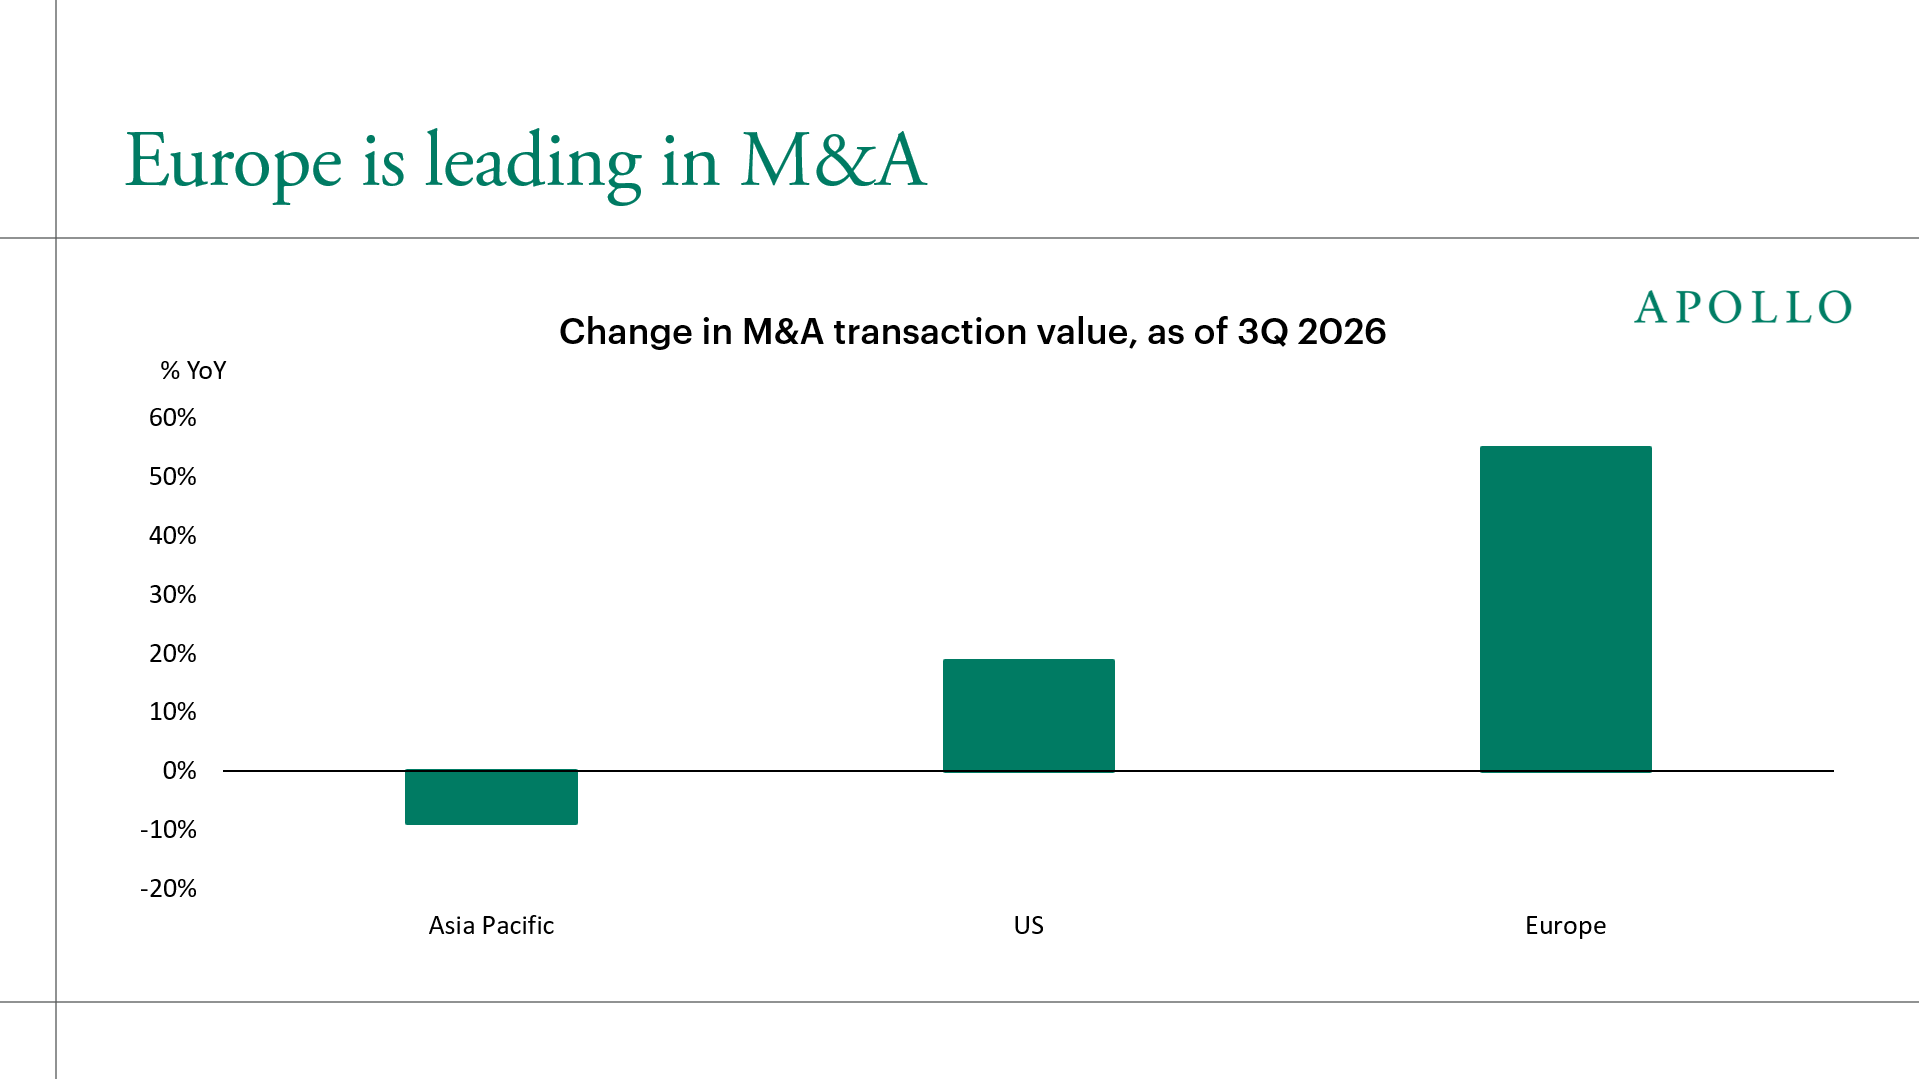
M&A is on pace for a near-record year, driven by the ongoing rapid technological change that is forcing firms to adapt to a new world.
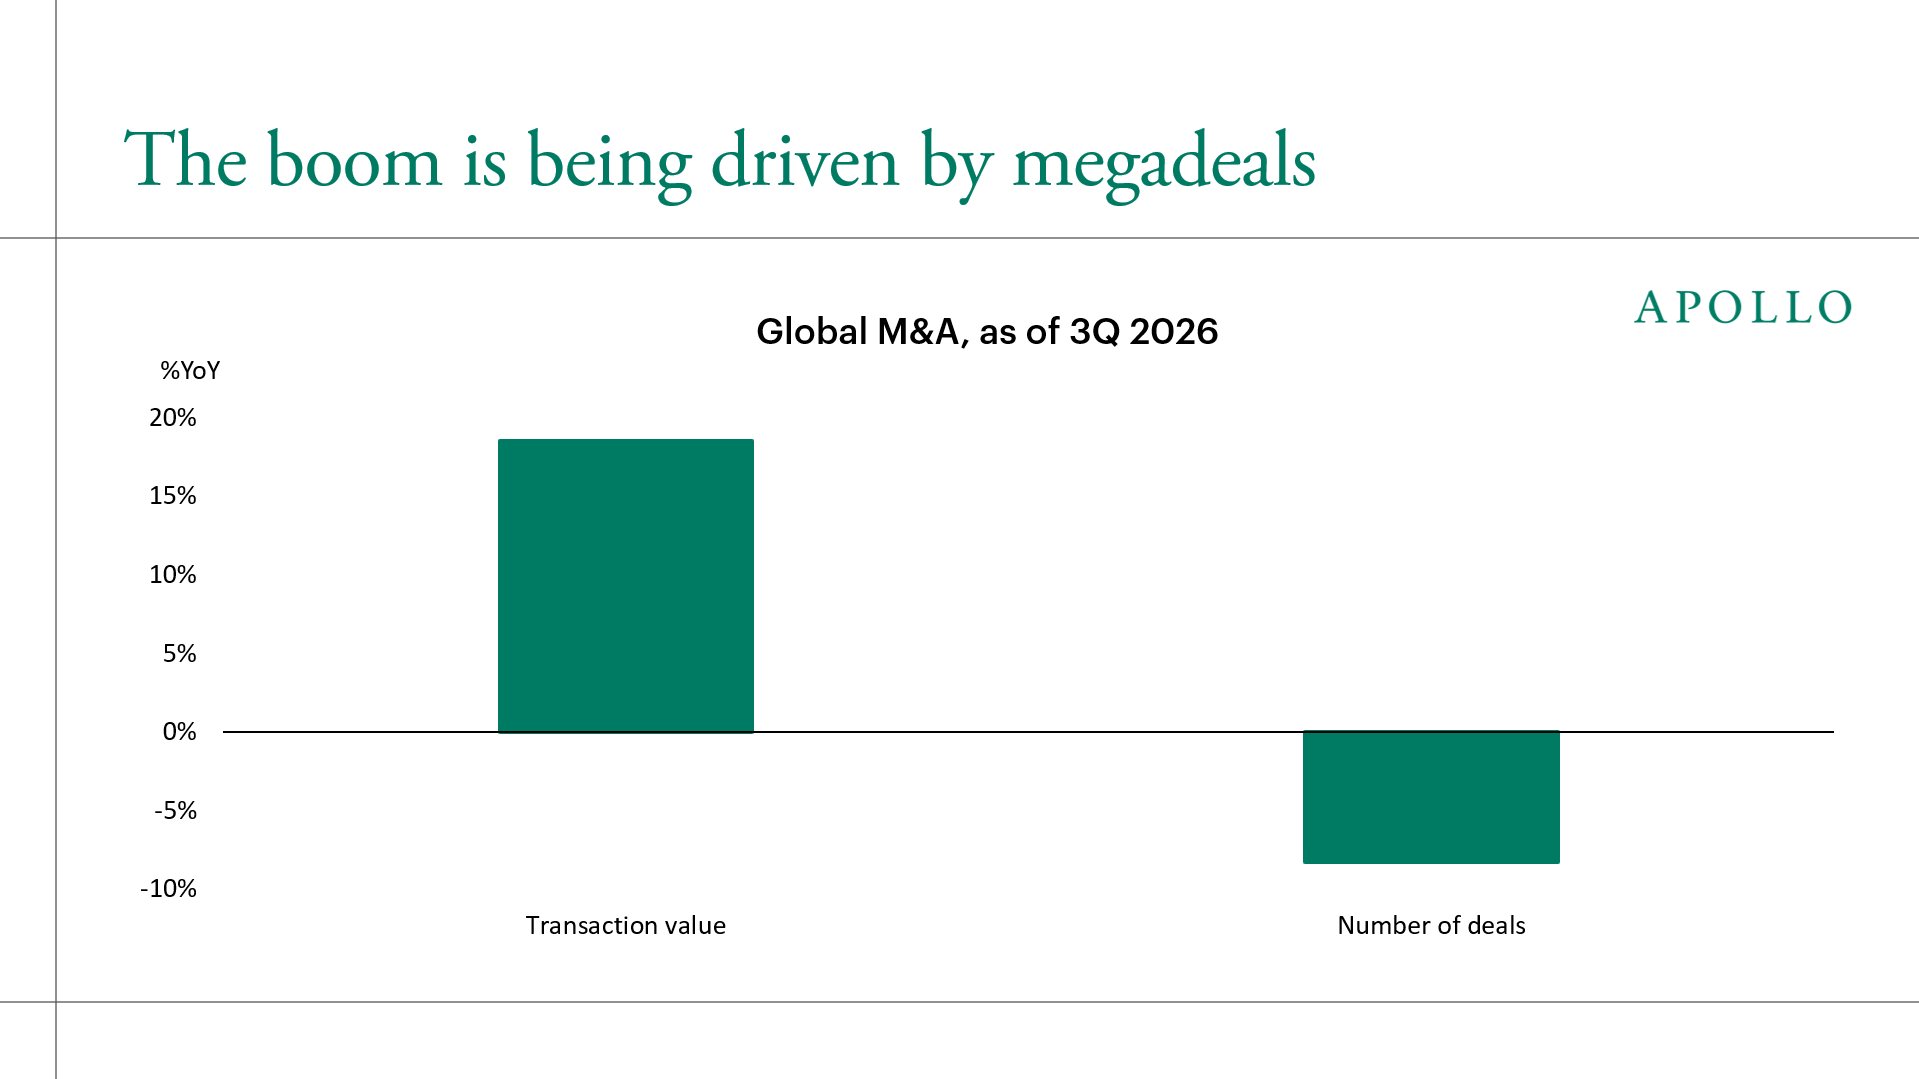
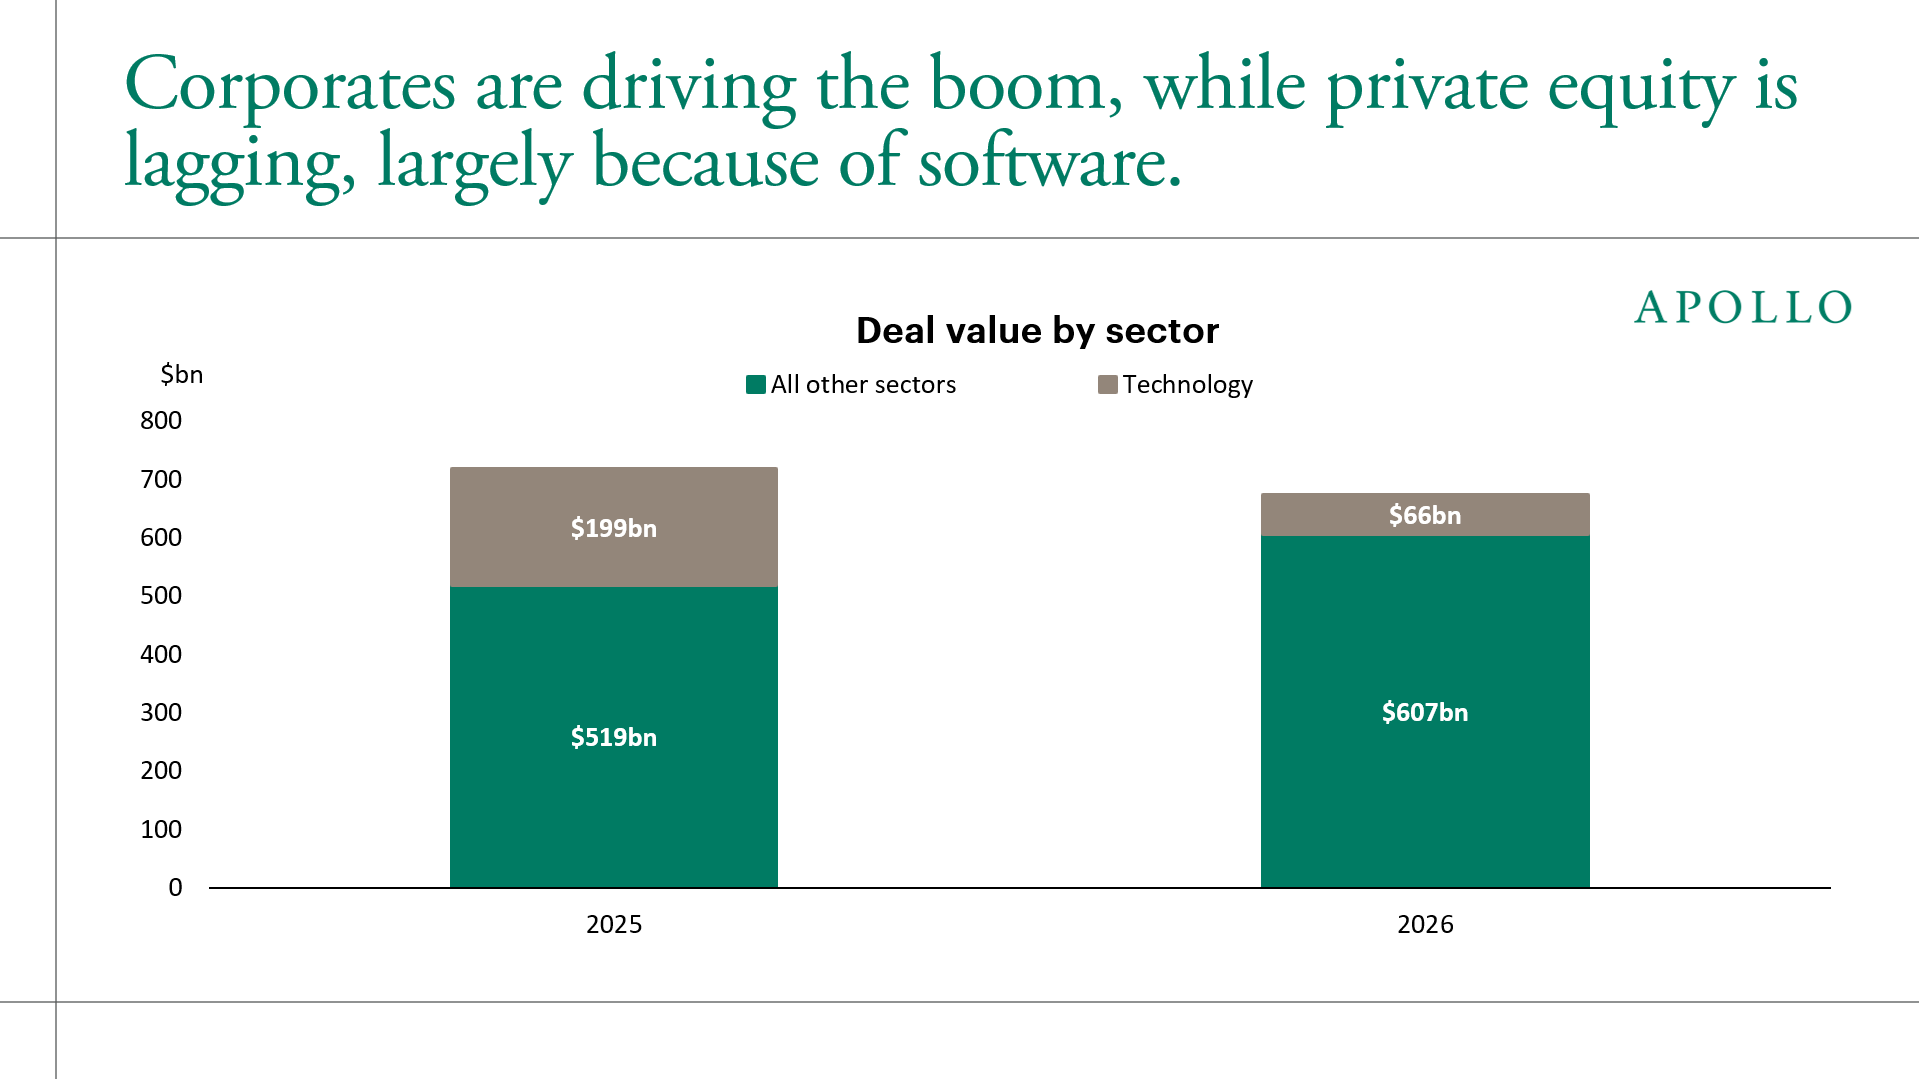
In the first nine months, 42 deals topped $10 billion, worth over $1.1 trillion, or 36% of all M&A value, see charts below. Big is getting bigger.
The bottom line is that the speed of change in AI, energy, infrastructure, defense and financial services has triggered action among many corporates, and the need for long-term, flexible capital to finance this change is enormous.
For more discussion, see also here.
Written by Huw van Steenis and Torsten Slok
Note: 2026 data as of 3Q 2026. Sources: S&P Capital IQ, Apollo European and Policy Strategist
Sources: S&P Capital IQ, Apollo European and Policy Strategist
Note: 2026 data as of September 30, 2026. Sources: EY analysis of Dealogic data, Apollo European and Policy Strategist
Sources: S&P Capital IQ, Apollo European and Policy Strategist
See important disclaimers at the bottom of the page.
Germany is hosting its Invest in Germany Summit this week, against the backdrop of rising investment needs in AI, infrastructure, defense and energy resilience.
Meeting these longer-term investment needs will require public and private capital across both credit and equity markets. And Germany starts with a relatively small pool of domestic institutional capital.
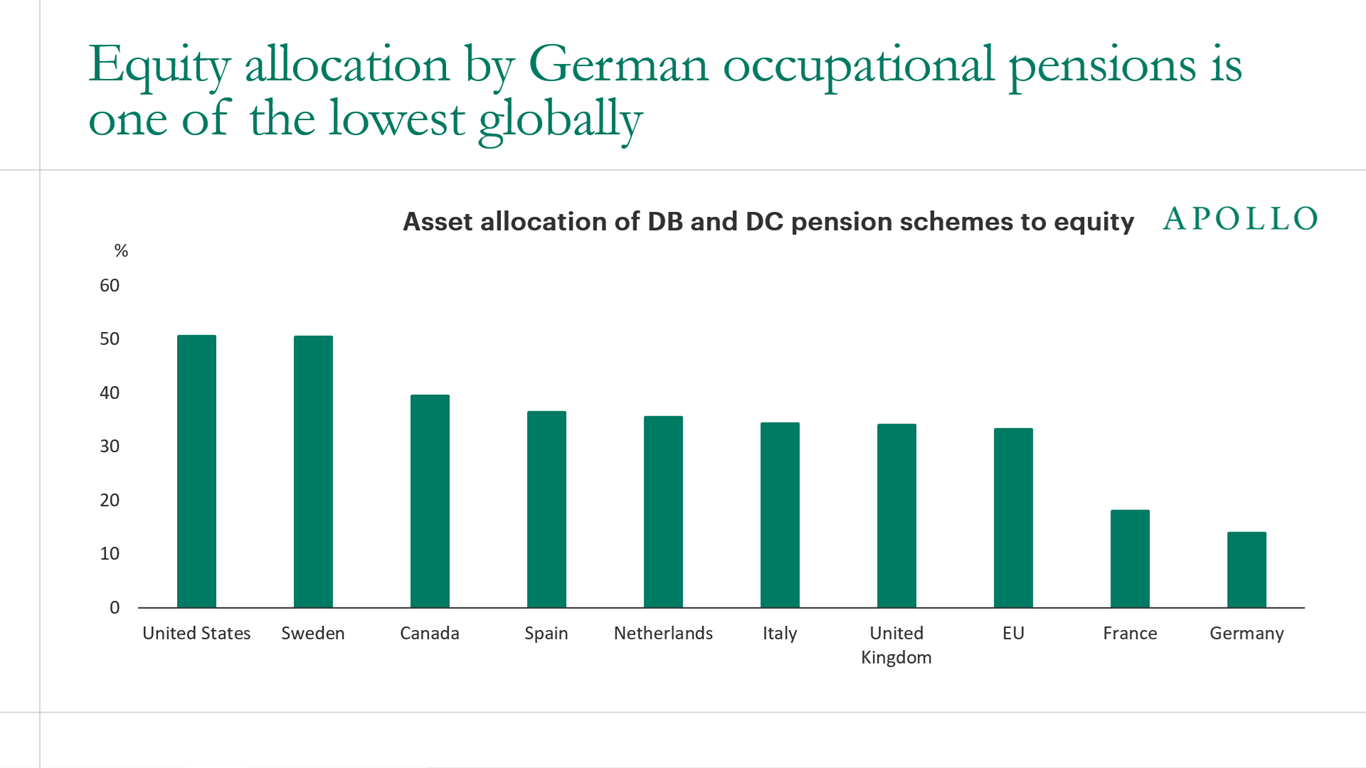
Germany has the least-funded pension system of any major advanced economy. Funded pension assets are only around 7% of GDP against 149% in Sweden and 185% in Canada. Furthermore, German occupational pension schemes allocate just 14% to equities, compared with 34% across the EU and around 50% in the US, see chart below.
Yet Germany has the highest household savings rate in Europe, with much of household wealth held in deposits.
This is why pension reform matters beyond retirement policy. The reforms now under way could ultimately generate around €90 billion of new annual funded pension flows, equivalent to roughly 2% of GDP.
The bottom line is that Germany is trying to increase investment at the same time as it builds a much larger domestic pool of long-term savings. Pension reform could help connect the two.
We look at the numbers, the reforms and the implications for capital markets in our new presentation on German pension reform, available here.
Written by Huw van Steenis
Sources: European Commission (2025), Staff Working Document, Table 35 (EU); Federal Reserve, Financial Accounts Z.1, Table S.129.s (US); Pensions Policy Institute (2025), Pension Scheme Assets, Figure 2 (UK); and Statistics Canada (2025), Trusteed Pension Funds, Q4 2024 (Canada); caveat: figures are not fully comparable, as the EU covers occupational pension institutions, the US includes public and private pensions and non-equity mutual funds, the UK includes broader retirement assets but excludes private equity, and Canada includes public and private occupational pensions with equity exposure estimated from reported data, Apollo European and Policy Strategist.
See important disclaimers at the bottom of the page.
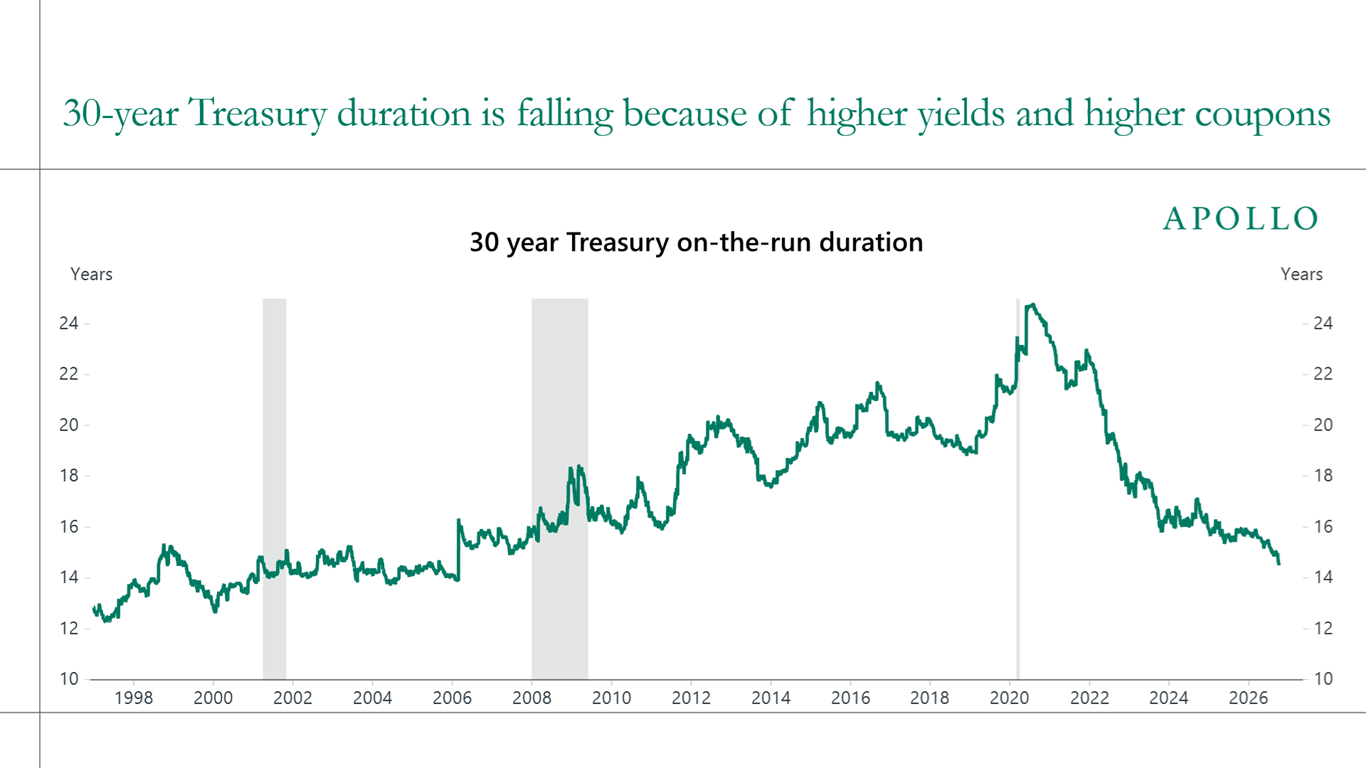
Duration measures how sensitive a bond’s price is to changes in interest rates, and for the 30-year Treasury, it has fallen from 25 years in 2020 to 14 today because of higher yields and higher coupons.
That means long Treasuries offer less cushion per dollar in a downturn.
As a result, investors may need to own more fixed income to hedge against the risk of a slowdown. Pairing Treasuries with high-quality credit can help.
Investment-grade private placements and infrastructure debt are often long-dated and fixed-rate, so they can carry meaningful duration, while asset-backed finance can add income, with duration varying by structure.
The bottom line is that when interest rates stay higher for longer, lower duration weakens the hedge that long Treasuries provide.
Sources: ICE BofAML, Macrobond, Apollo Chief Economist
See important disclaimers at the bottom of the page.
October 16, 2026
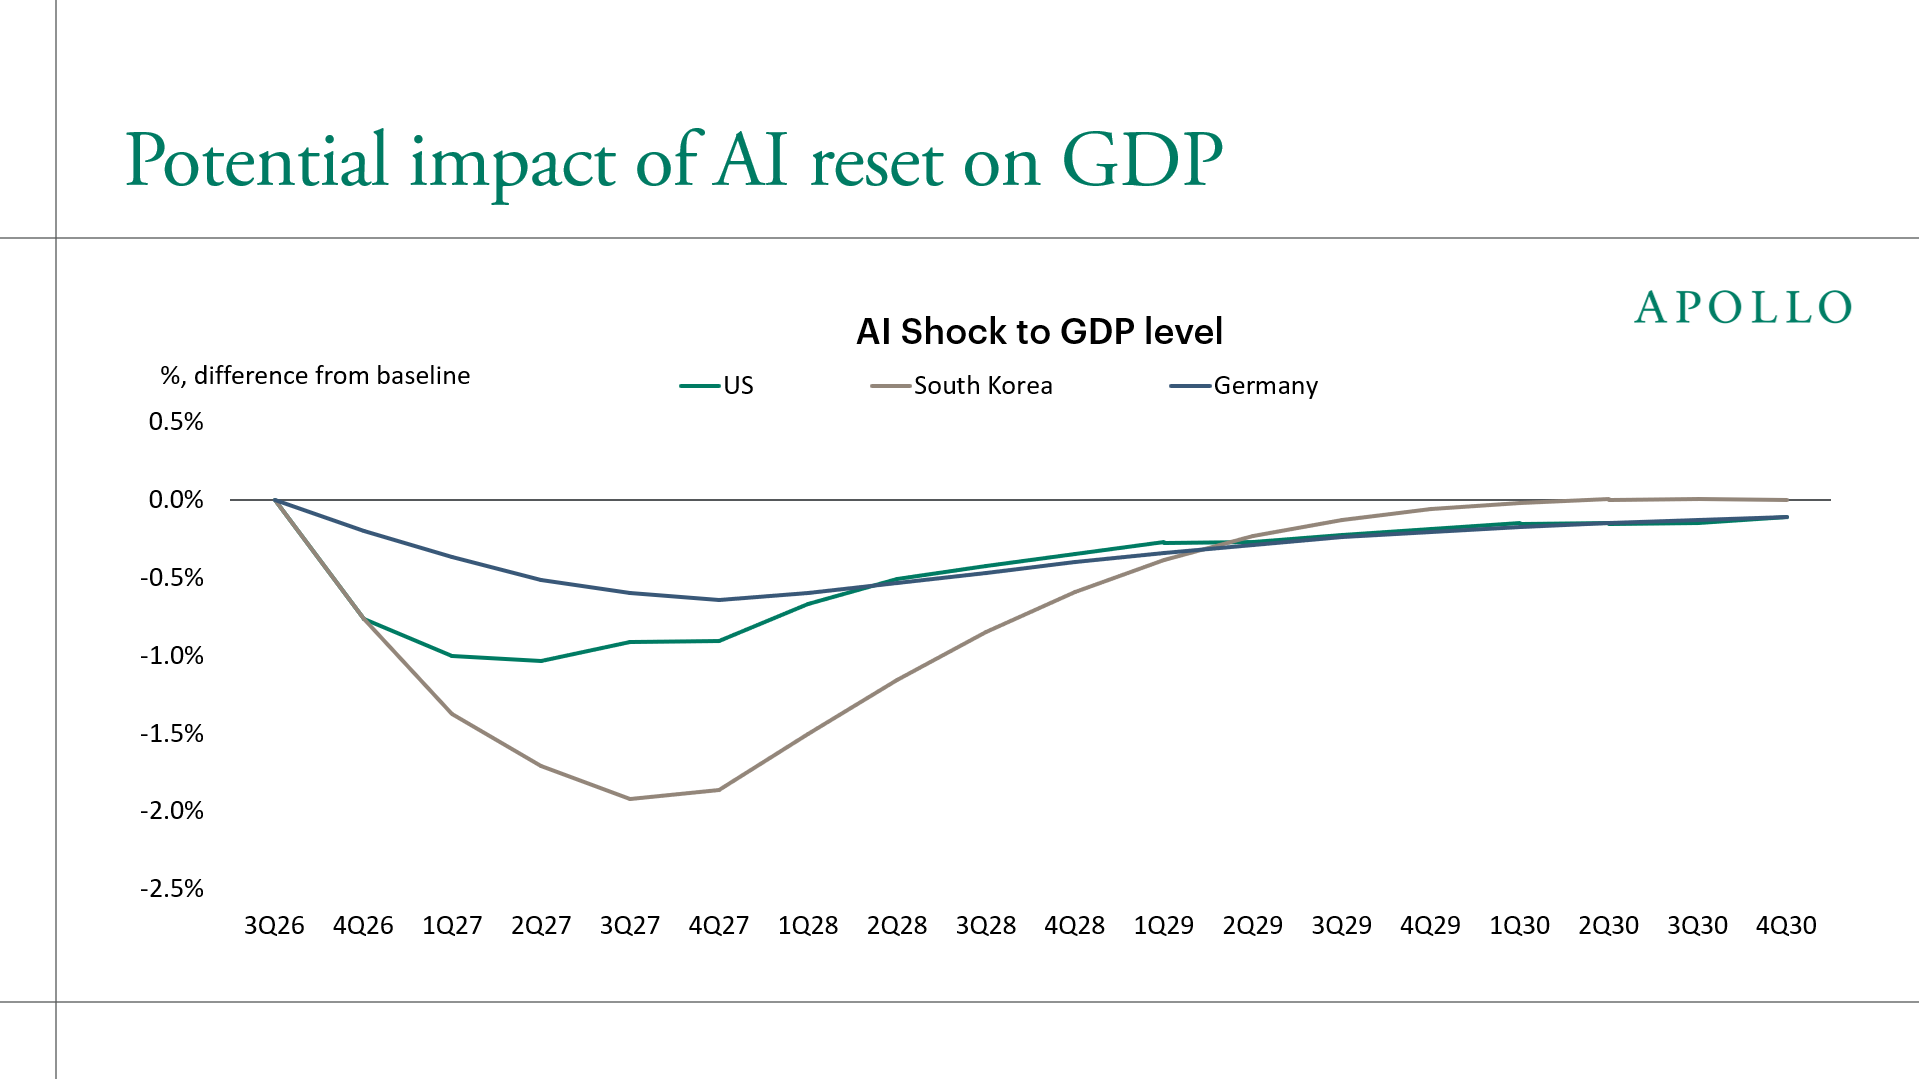
Let’s call the ongoing correction in AI assets "The AI Reset," where investors mark down their expectations for future cash flows.
What are the implications for the economy?
A sharp reset in AI expectations could undermine corporate confidence, trigger a pullback in capex and weigh on GDP growth, just as higher oil prices, tariffs and tighter immigration restrictions push inflation higher, raising the risk of a stagflationary environment in which growth slows even as price pressures persist.
Note: Bloomberg SHOK model scenario assumes a widening in global credit spreads of 10–30 bps, a 1–4% decline in US investment and a 1–3% decline in South Korean exports, with shocks phased in from 4Q26 and tapering through 4Q27. GDP impacts are shown as percentage deviations from baseline forecasts. Sources: Bloomberg SHOK, Apollo Chief Economist
See important disclaimers at the bottom of the page.