Illustration of a glowing light bulb with a stylized capital “A” filament centered inside, symbolizing ideas, innovation, and insight against a green circular background.

The Daily Spark

Stay ahead of the markets with The Daily Spark at Apollo. Get exclusive, daily data-driven analysis on the US economy, inflation, and capital markets from Apollo Chief Economist Torsten Slok.
Subscribe About the Author

Not subscribed yet? Get the Daily Spark delivered to your inbox.

Subscribe
Filters
Topics
1-10 of 577 Results
Monetary & Fiscal Policy

August 01, 2026

Why Did Long Rates Go Up During the Fed Press Conference?

Share

The chart below looks at what Fed chair Kevin Warsh said during the press conference minute-by-minute:

  1. There was no specific moment during the press conference where long rates jumped higher.
  2. There were several instances when Warsh said something hawkish where rates began to go down.
  3. Rates went up more after the press conference was over than during the press conference.

This pattern reveals something important about what's driving the market reaction to Fedspeak, including the steepening of the yield curve.

One interpretation of what happened is that markets understand the Fed’s commitment to 2% inflation, but with no forward guidance, the market does not understand how the Fed will get to 2% inflation.

Is the way to 2% inflation through higher rates, a smaller balance sheet or tighter financial conditions? The answer to this has significant implications for the yield curve and how and when we will achieve 2% inflation. The lack of clarity about how to get there is what's pushing yields higher because there is now a risk that it may take longer or involve a policy mistake.

Imagine saying: “I will take you from New York to Los Angeles, but I'm not telling you how quickly, what it will cost or how you'll get there." By not explaining these important elements, you may question if we are actually getting to Los Angeles.

The risk with abandoning forward guidance is a steeper yield curve with investors asking more questions about the journey ahead, which is what we have seen since the statement came out.

The bottom line is that an important part of the Fed’s credibility is not just to say that it has certain goals but also to explain how it will achieve those goals.

Download high-res chart

See important disclaimers at the bottom of the page.

Macroeconomic Indicators & Trends

July 31, 2026

Higher for Longer Continues

Share

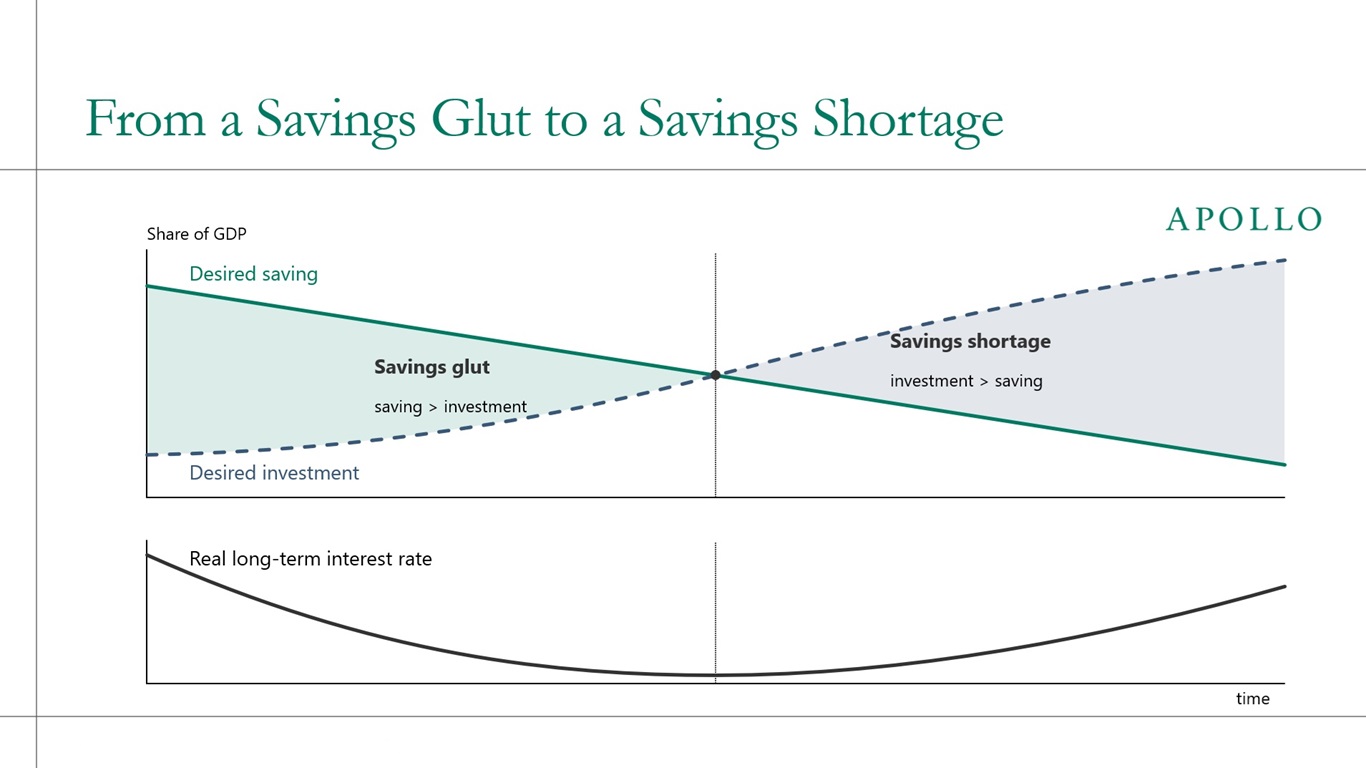
Why are long rates at the highest level in 20 years?

1) Inflation
2) Fiscal problems
3) Hyperscaler issuance

The bottom line is that we're not going back to the 2010s, and this is good news for everyone cutting coupons in high-quality fixed income.

Download high-res chart

See important disclaimers at the bottom of the page.

Macroeconomic Indicators & Trends

July 30, 2026

AI Lowers Wages But Doesn't Cut Jobs

Share

Analysis of actual Claude usage data shows workers in AI-exposed occupations are experiencing slower wage growth, while employment levels in these occupations remain unchanged, suggesting companies are capturing AI productivity gains through wage compression rather than workforce reduction.

This paper was written by Sania Edlich and me using a difference-in-differences methodology with occupation and year fixed effects across 321 matched occupations from 2015 to today. The paper is available here.

Download white paper

See important disclaimers at the bottom of the page.

Financial Markets & Risk Dynamics

July 29, 2026

The Market Is Asking Questions

Share

CDS spreads have started to widen out for names in AI, and the market is asking three fundamental questions:

1) Will the AI capex pay off, and how quickly? With trillions committed to data centers, chips and power up front, the question is whether AI monetization ramps fast enough to clear the cost of capital before the assets depreciate, or whether it's an overbuild whose ROIC never catches up to its WACC on a massive, front-loaded outlay. For more, see also here.

2) How is all of this being financed, and at what spread? Hyperscaler spreads are widening as the buildout is increasingly funded with debt rather than organic free cash flow, and as issuance surges, the question is whether the all-in yield climbs to a level where the marginal data-center dollar no longer clears its return hurdle, forcing the capex cycle to self-throttle.

3) Will there be unlimited demand for compute, or will compute demand peak? The bull case assumes demand is effectively insatiable as inference workloads, agentic systems and new model generations compound, but the risk is that efficiency gains, model commoditization or slower-than-expected enterprise adoption cause demand to plateau well below the capacity now being built, leaving the industry with a glut of expensive, rapidly depreciating infrastructure.

Download high-res charts

See important disclaimers at the bottom of the page.

Financial Markets & Risk Dynamics

July 28, 2026

Consensus Just Revised Up Capex for Hyperscalers: FCF Takes a Hit

Share

Over the past month, the consensus has revised up operating cash flow expectations for hyperscalers over the next five years, see the first chart.

However, capex expectations have been revised up even more sharply, see the second chart.

As a result, the consensus now expects free cash flow to be materially lower over the same period, see the third chart.

The bottom line is that the consensus has over the past month meaningfully increased its near-term hyperscaler capex forecast, reducing expected free cash flow despite stronger operating cash flow forecasts.

For investors, the key question remains the speed with which these capex investments will translate into proportional revenue or profit growth, see also here.

Download high-res charts

See important disclaimers at the bottom of the page.

Macroeconomic Indicators & Trends

July 27, 2026

Why America Remains the Best Place to Do Business

Share

US enterprises survive longer than their global peers due to a combination of easier access to capital, market size, flexible labor markets that let companies adjust costs quickly and lighter regulation that enables faster growth and faster pivots, see chart below.

Download high-res chart

See important disclaimers at the bottom of the page.

Financial Markets & Risk Dynamics

July 26, 2026

Not All Software Is Bad

Share

The recent performance of US software indices reveals a stark divergence in market expectations regarding the disruptive threat of AI, see chart below.

High-level groupings seen as AI-immune, such as security software and infrastructure software, have significantly outperformed the broad benchmark because they provide the critical data backbones, compute pipelines and complex protection systems that generative models actively expand rather than displace.

Conversely, categories deemed AI-vulnerable, specifically application software and vertical software, are severely lagging behind as investors price in potential disintermediation, lower switching costs and reduced seat-based licensing demand driven by automated AI workflows.

The bottom line is that the market is clearly favoring foundational security and infrastructure layers over legacy applications as artificial intelligence reshapes software business models.

Download high-res chart

See important disclaimers at the bottom of the page.

Macroeconomic Indicators & Trends

July 25, 2026

The Mess Is Your Moat

Share

Luis Gariçano's insight that AI autonomy declines with job messiness reveals an important truth about which work faces displacement. It's routine, transactional roles that are vulnerable, not the complex relationship-driven work we assume is most at risk.

As tasks grow messier, AI capability stalls while human judgment becomes indispensable, drawing an autonomy threshold that protects messy work from replacement, see chart below and video here.

Download high-res chart

See important disclaimers at the bottom of the page.

Global & Geopolitical Developments

July 24, 2026

Supply Chains Under Pressure: Adding Nine Days

Share

When Bab el-Mandeb adds nine days to ocean routes, shippers pay premium rates for trucking to compensate, pushing costs higher for global trade.

These cascading transportation costs put some upward pressure on consumer prices, keeping inflation sticky and limiting the Fed's ability to cut rates, see charts below.

Download high-res charts

See important disclaimers at the bottom of the page.

Financial Markets & Risk Dynamics

July 23, 2026

IPOs Have Been a Losing Bet Since 2019

Share

The chart below shows that IPOs since 2019 have underperformed the broader market over the following three years, driven by three main forces:

1) Peak valuations: The 2020–2021 wave came public at rich multiples amid zero rates, stimulus and speculative retail demand, leaving little room for gains.

2) A hostile rate regime: The Fed's hiking cycle from 2022 compressed valuations and hit the long-duration, unprofitable growth stocks that dominate IPO cohorts hardest.

3) Low quality, high bar: The boom pushed marginal companies public before they were ready while the market-adjusted benchmark was set against an index carried by a handful of mega-cap winners.

Each of these forces could persist: valuations may re-inflate in the next IPO window, rates look set to stay structurally higher than the 2010s and index returns remain concentrated in a few mega-caps that keep the relative bar high.

Download high-res chart

See important disclaimers at the bottom of the page.

This presentation may not be distributed, transmitted or otherwise communicated to others in whole or in part without the express consent of Apollo Global Management, Inc. (together with its subsidiaries, “Apollo”).

Apollo makes no representation or warranty, expressed or implied, with respect to the accuracy, reasonableness, or completeness of any of the statements made during this presentation, including, but not limited to, statements obtained from third parties. Opinions, estimates and projections constitute the current judgment of the speaker as of the date indicated. They do not necessarily reflect the views and opinions of Apollo and are subject to change at any time without notice. Apollo does not have any responsibility to update this presentation to account for such changes. There can be no assurance that any trends discussed during this presentation will continue.

Statements made throughout this presentation are not intended to provide, and should not be relied upon for, accounting, legal or tax advice and do not constitute an investment recommendation or investment advice. Investors should make an independent investigation of the information discussed during this presentation, including consulting their tax, legal, accounting or other advisors about such information. Apollo does not act for you and is not responsible for providing you with the protections afforded to its clients. This presentation does not constitute an offer to sell, or the solicitation of an offer to buy, any security, product or service, including interest in any investment product or fund or account managed or advised by Apollo.

Certain statements made throughout this presentation may be “forward-looking” in nature. Due to various risks and uncertainties, actual events or results may differ materially from those reflected or contemplated in such forward-looking information. As such, undue reliance should not be placed on such statements. Forward-looking statements may be identified by the use of terminology including, but not limited to, “may”, “will”, “should”, “expect”, “anticipate”, “target”, “project”, “estimate”, “intend”, “continue” or “believe” or the negatives thereof or other variations thereon or comparable terminology.