Illustration of a glowing light bulb with a stylized capital “A” filament centered inside, symbolizing ideas, innovation, and insight against a green circular background.

The Daily Spark

Stay ahead of the markets with The Daily Spark at Apollo. Get exclusive, daily data-driven analysis on the US economy, inflation, and capital markets from Apollo Chief Economist Torsten Slok.
Subscribe About the Author

Not subscribed yet? Get the Daily Spark delivered to your inbox.

Subscribe
Filters
Topics
1-10 of 687 Results
Financial Markets & Risk Dynamics

November 20, 2026

Higher for Longer Makes High-Quality Credit More Attractive

Share

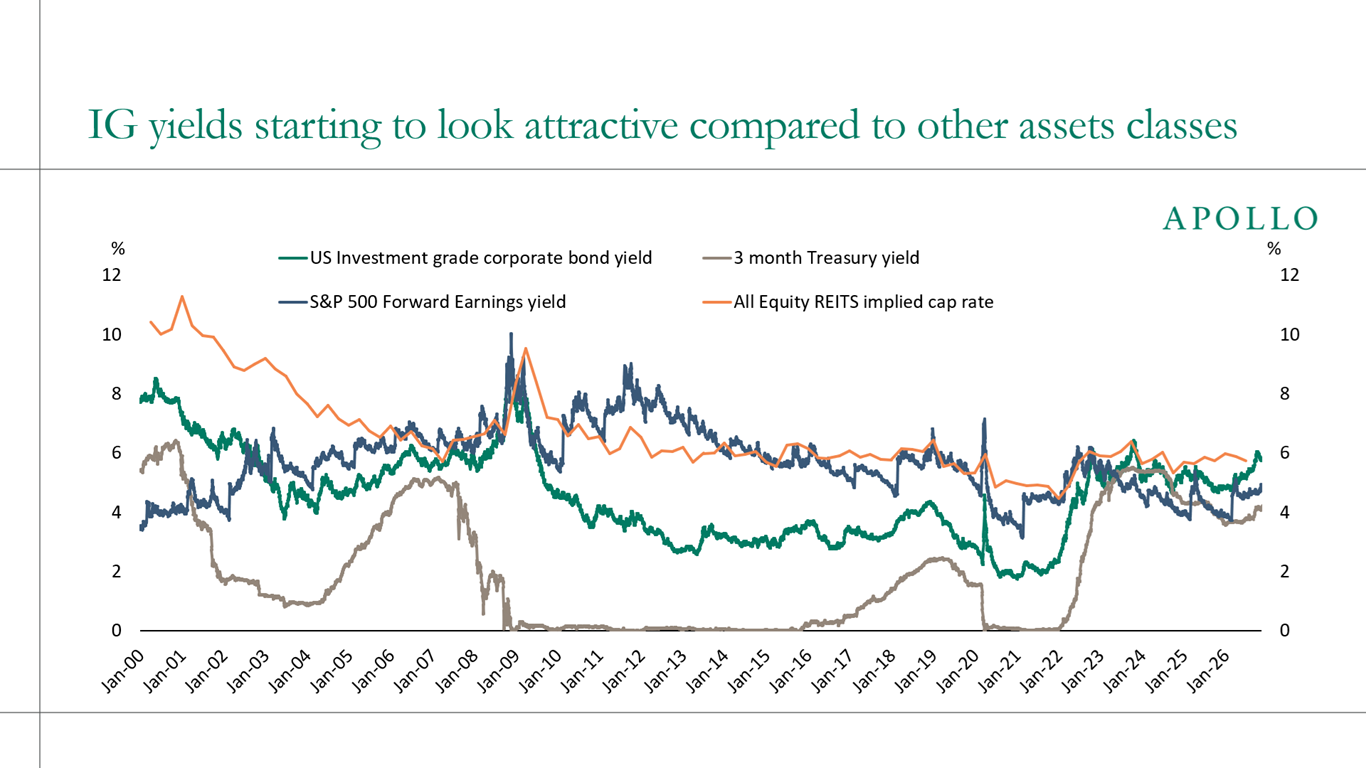
The convergence in yields across asset classes is remarkable, see chart below.

The all-in yield on US investment-grade corporate bonds has moved up to around 6%, now at the top of the range. That is above the S&P 500 forward earnings yield of around 4.5% and above the implied cap rate on all-equity REITs of around 5.7%.

In other words, investors are now paid more to own high-quality credit than to own equities, and with a lot less volatility. The last time IG yields were this far above the S&P 500 earnings yield was in the early 2000s.

Even the 3-month Treasury yield, at around 4%, is now close to the S&P 500 earnings yield. With the AI trade wobbling and the equity risk premium compressed, the case for taking equity risk looks less compelling than it did a few years ago, while all-in yields in high-quality fixed income look increasingly attractive.

Download high-res chart

See important disclaimers at the bottom of the page.

Macroeconomic Indicators & Trends

November 19, 2026

AI Spending Powers 65% of GDP Growth

Share

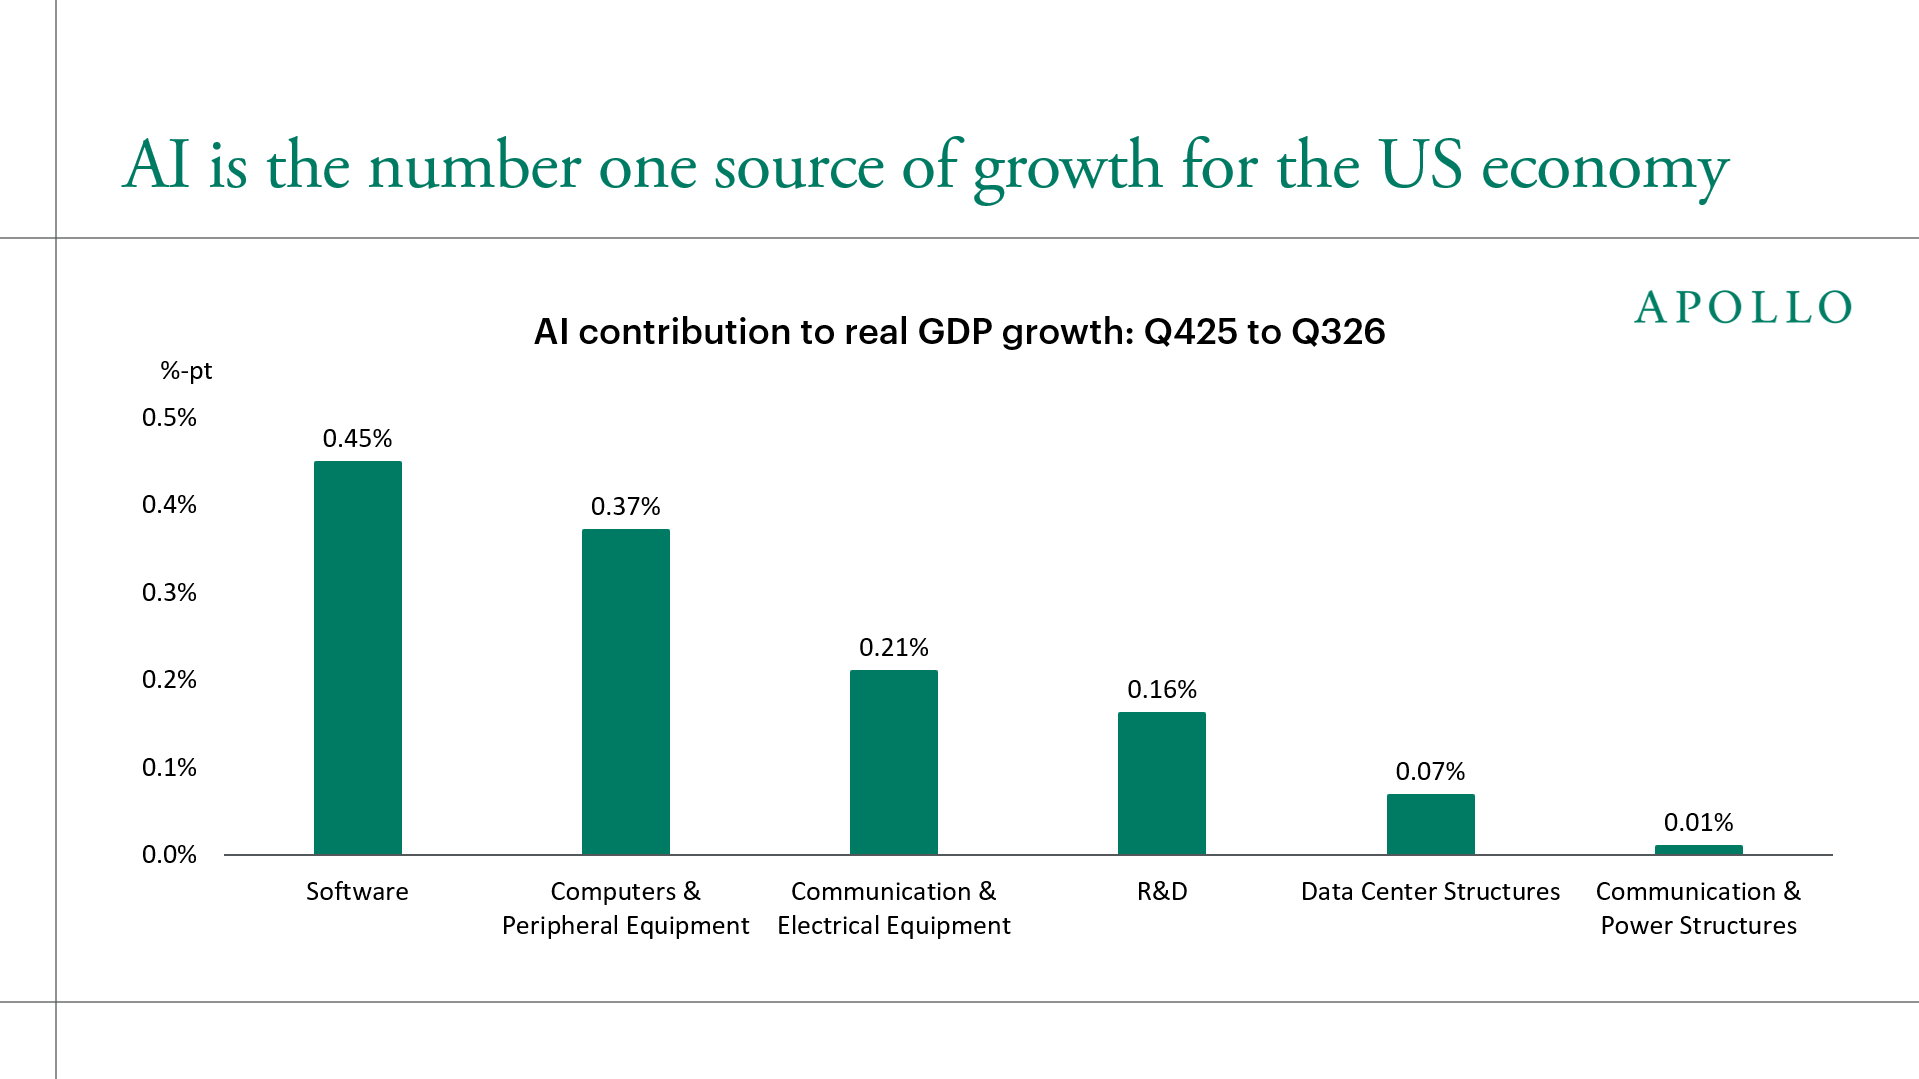
AI investment added roughly 1.3 percentage points to real GDP growth over the last three quarters, or about 65% of the roughly 2% cumulative growth, led by software and computers, see chart below. These are gross figures that do not net out imports, so the net boost in the national accounts is likely somewhat smaller.

The bottom line is that AI is the number one source of growth for the US economy, and anyone making statements about the 2027 outlook for equity and credit markets is implicitly making assumptions about the pace and magnitude of the AI data center buildout.

Download high-res chart

See important disclaimers at the bottom of the page.

Macroeconomic Indicators & Trends

November 18, 2026

Half of Southern Europe’s Young Adults Still Live With Their Parents

Share

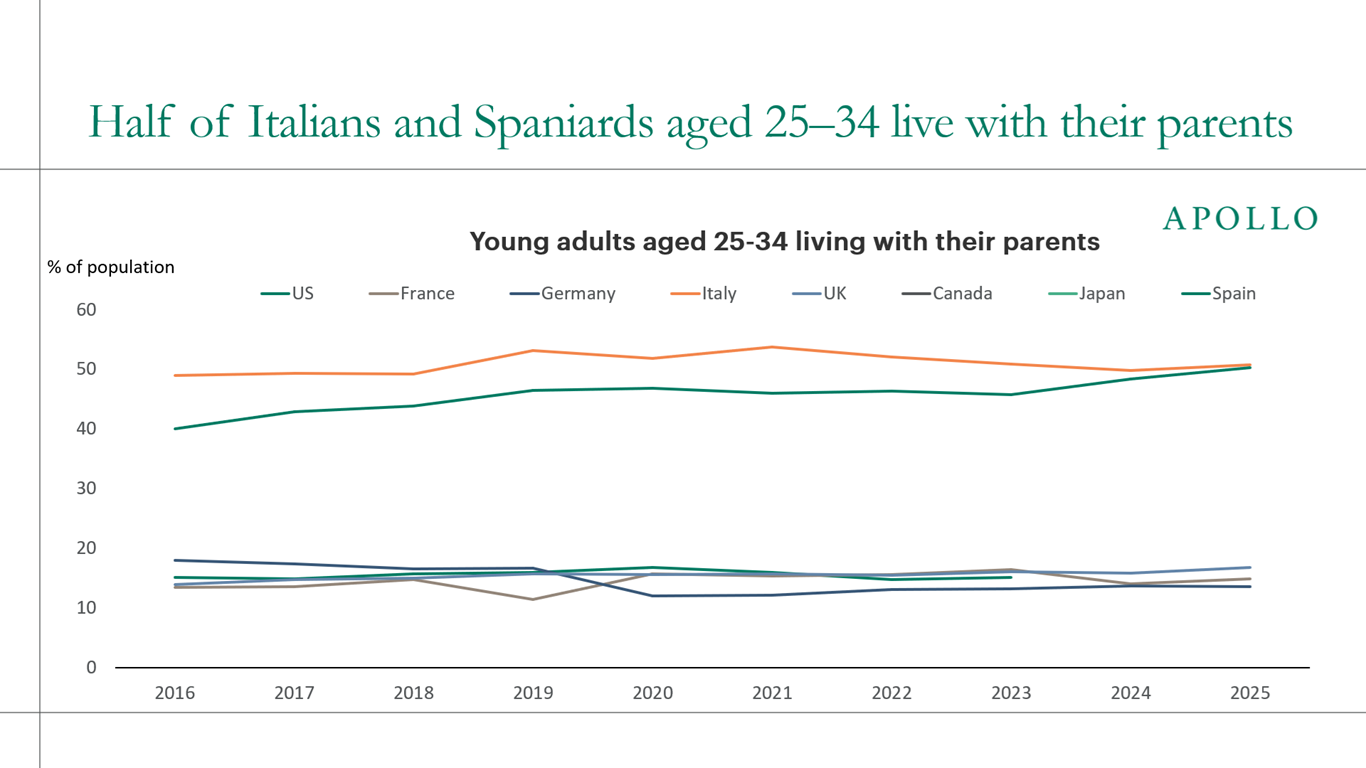
In Italy and Spain, half of 25-34-year-olds live with their parents. In the US, it’s about one in six, see chart below.

Download high-res chart

See important disclaimers at the bottom of the page.

Macroeconomic Indicators & Trends

November 17, 2026

The US Retirement Savings Crisis

Share

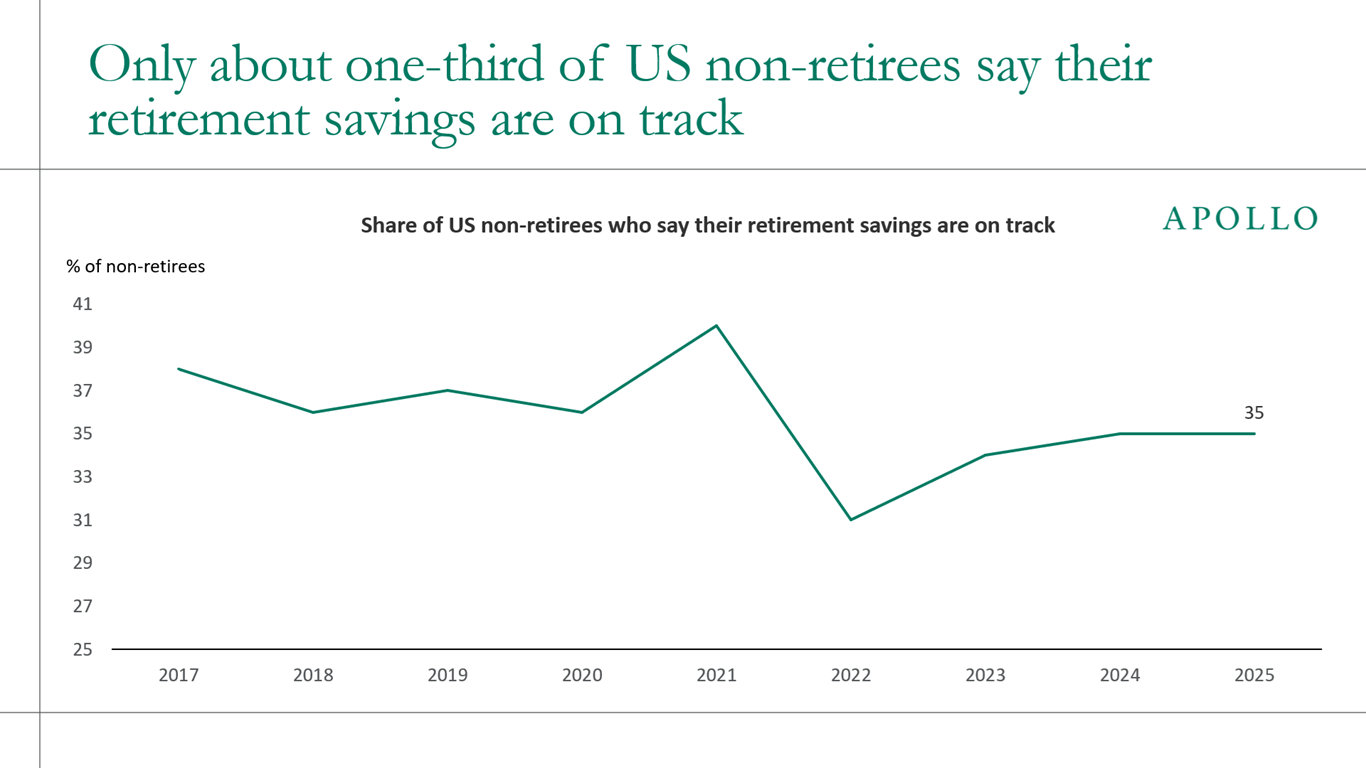
Nearly two-thirds of Americans aren’t confident their retirement savings are on track, see chart below. The bottom line is that more retirement savings are needed.

Download high-res chart

See important disclaimers at the bottom of the page.

Monetary & Fiscal Policy

November 16, 2026

Higher Rates Hit the Fiscal Side, Not the Private Sector

Share

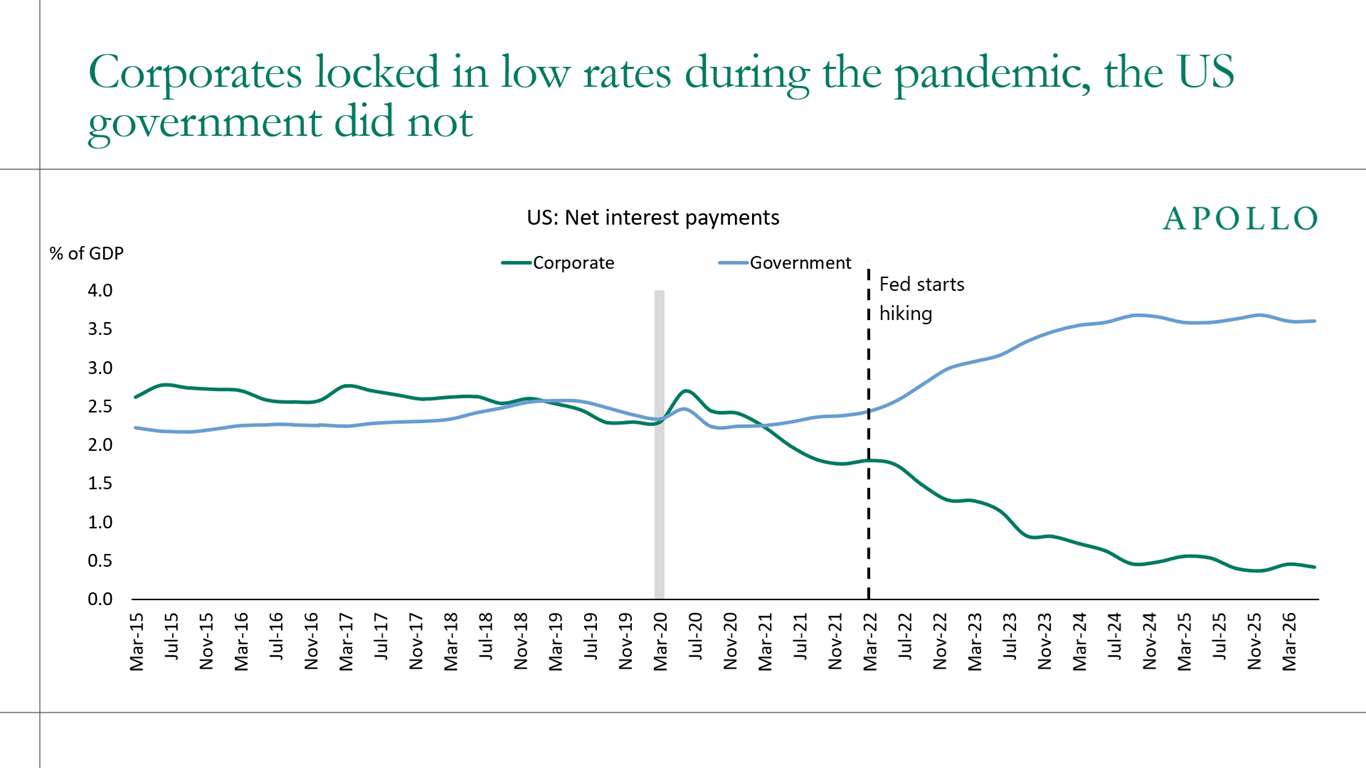
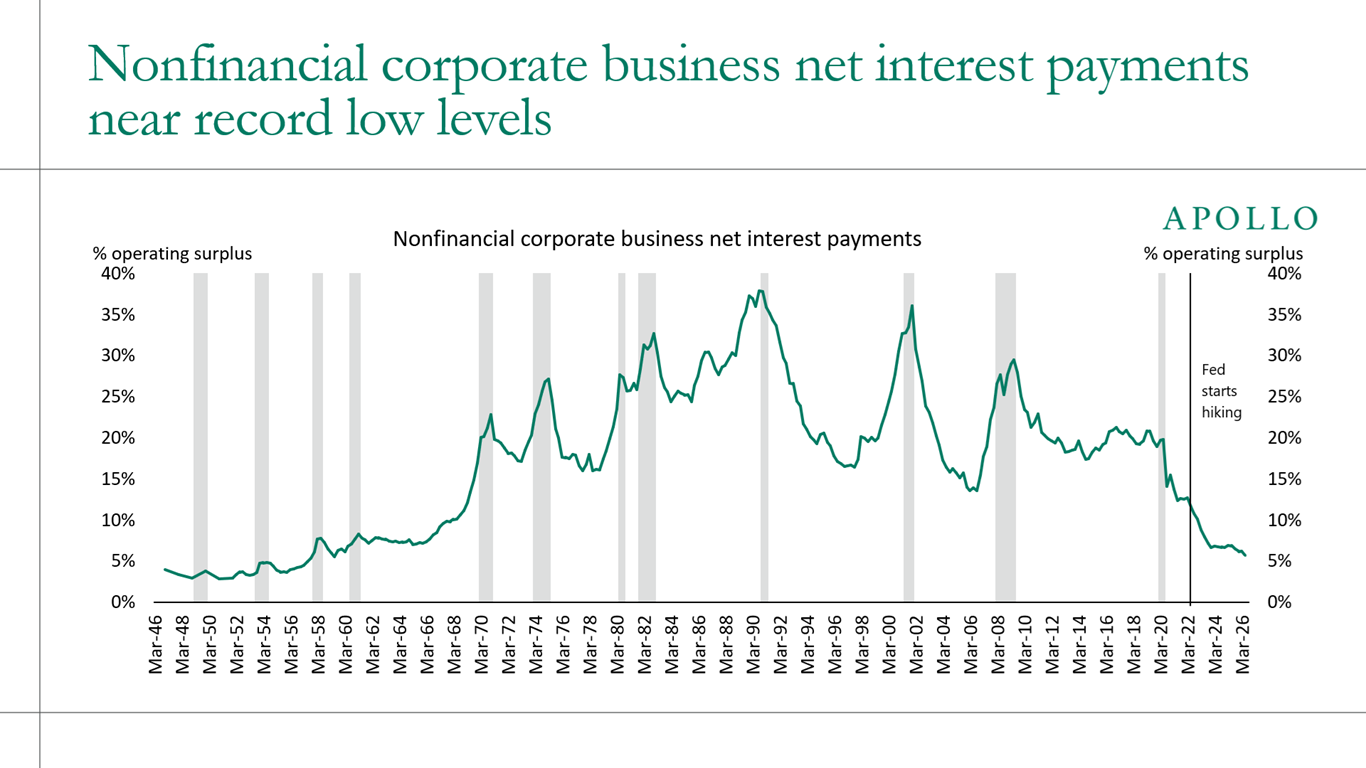
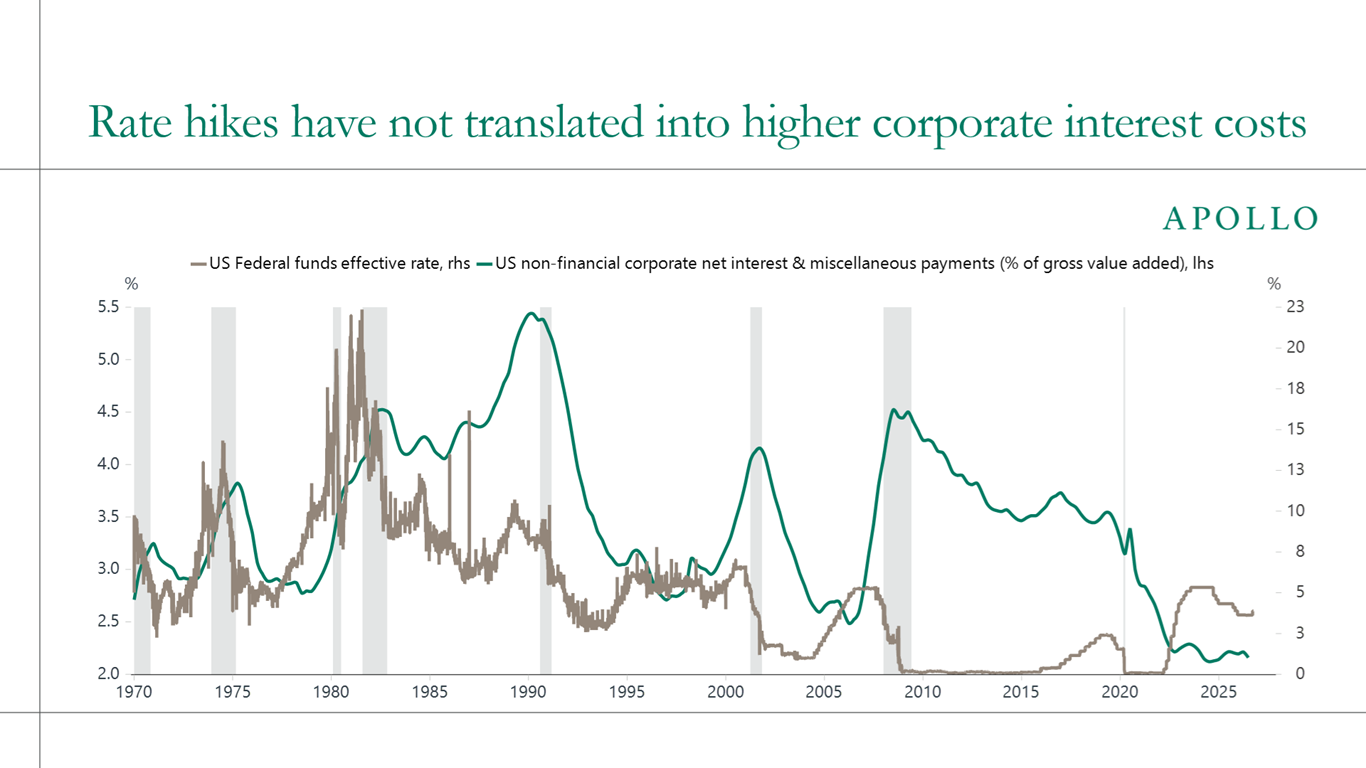
Corporate America and households both locked in low rates during the pandemic, with firms refinancing their debt and homeowners securing record-low mortgages.

Washington didn’t, and its interest bill has more than doubled from about $500 billion in summer 2020 to about $1.25 trillion today, so the economy is now far more sensitive to rates through the government than through the private sector, see charts below.

The bottom line is that the cost of higher rates has landed on the fiscal side rather than on companies and consumers, which is why the tightening cycle has done so little to slow the private economy.

Download high-res charts

See important disclaimers at the bottom of the page.

Macroeconomic Indicators & Trends

November 15, 2026

The AI Entrepreneurship Boom

Share

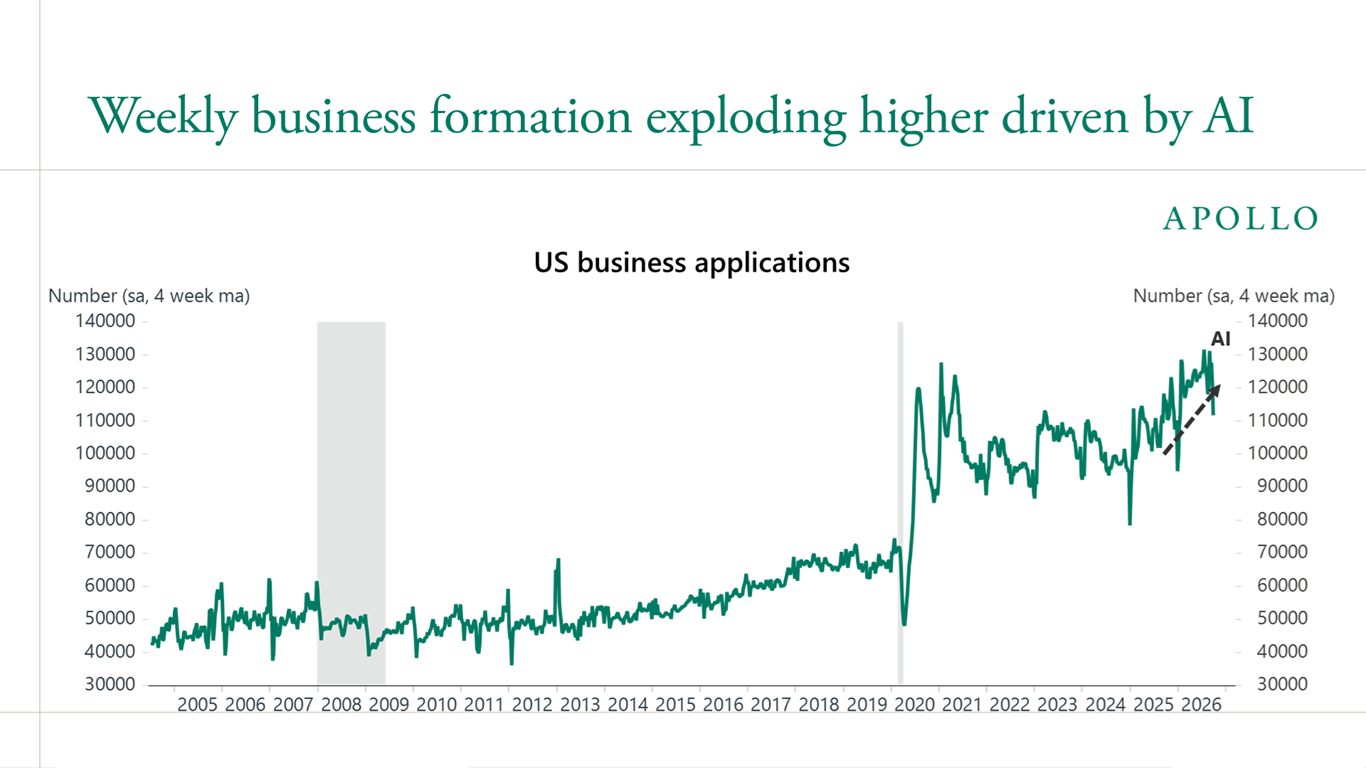
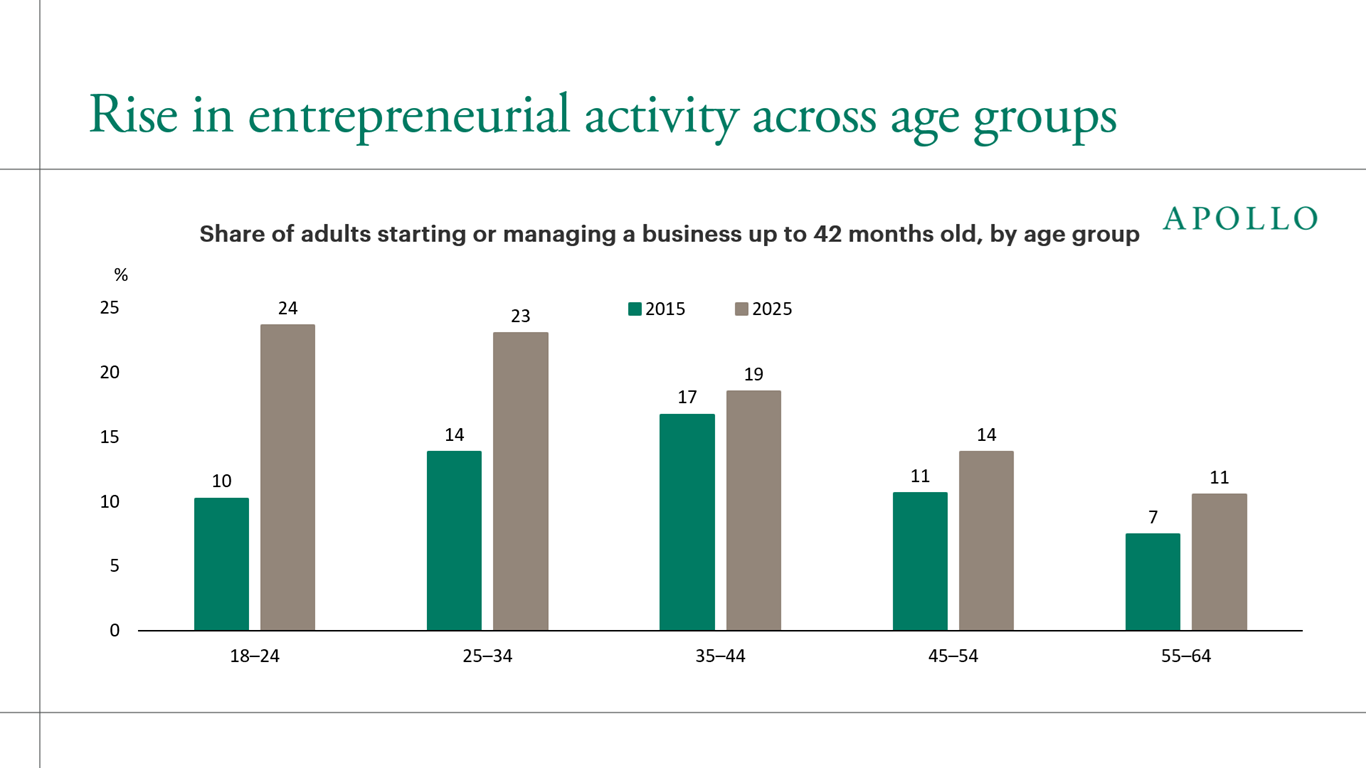
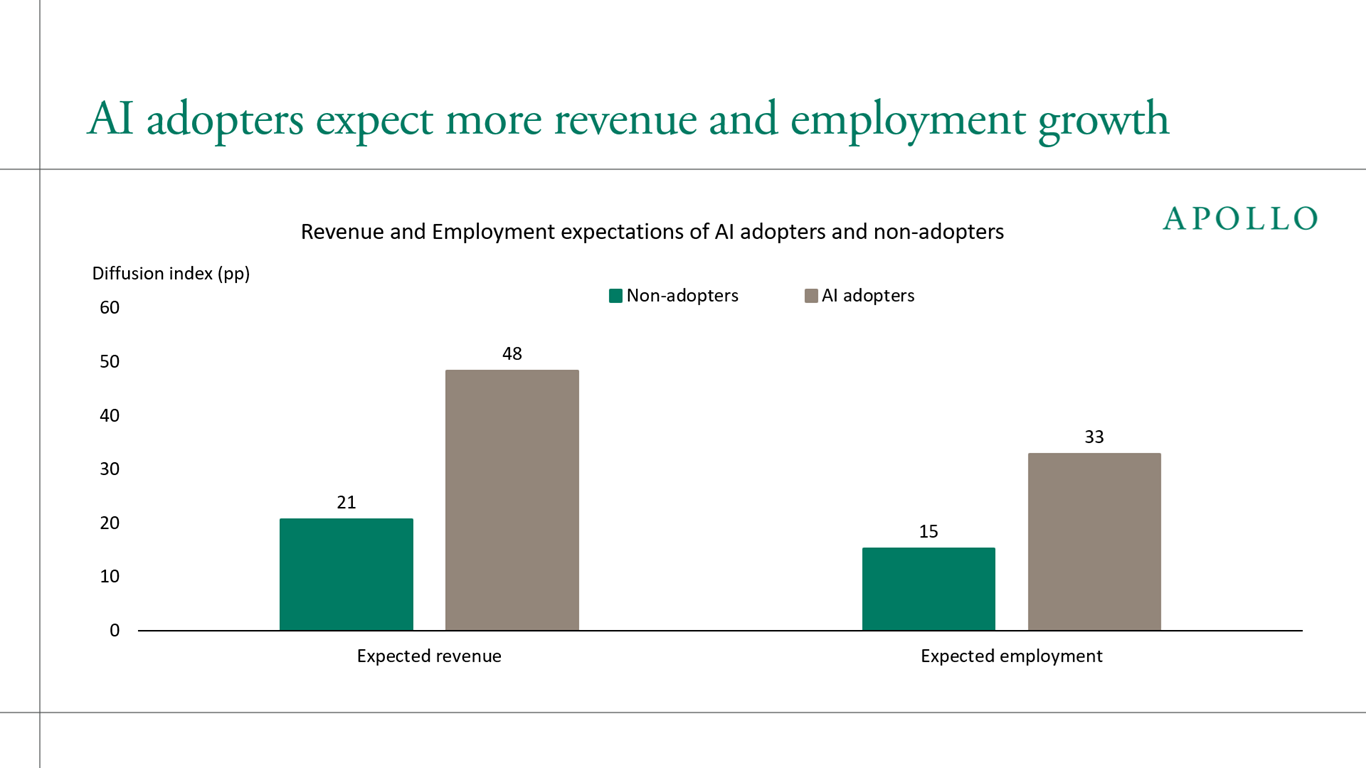
AI is making it much easier to start a business. Entrepreneurial activity continues to rise across all age groups, and AI adopters expect to see faster employment growth than non-adopters, see charts below.

The bottom line is that AI is making the economy more dynamic, and the job-creating effect of AI is far bigger than the labor displacement effect.

For more discussion of the net positive effect of AI on employment, see our previous Sparks:

Download high-res charts

See important disclaimers at the bottom of the page.

Monetary & Fiscal Policy

November 14, 2026

Strong Growth, Rising Prices and a Fed Behind the Curve

Share

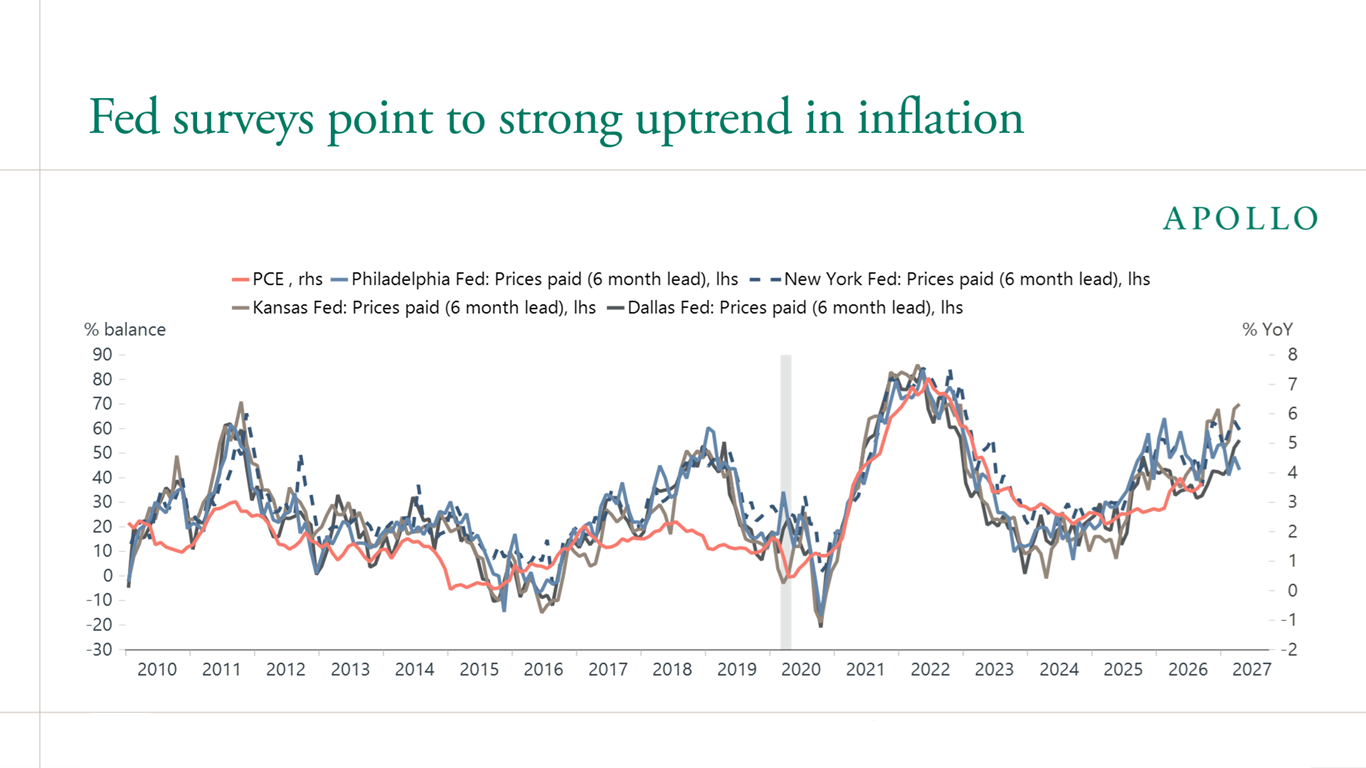
October nonfarm payrolls and CPI were strong, the AI spending boom continues and the Atlanta Fed estimates fourth-quarter GDP growth at 3.5%, significantly above the 2% potential growth rate.

At the same time, regional Fed surveys of prices paid, shifted six months forward, point to a continued strong uptrend in inflation, with PCE inflation moving towards 6%, see chart below.

The bottom line is that strong demand, combined with ongoing supply shocks to imports, labor and energy, raises the risk that the Fed is falling behind the curve and will have to raise rates much more than markets currently expect.

For more discussion, see also our recent Spark here.

Download high-res chart

See important disclaimers at the bottom of the page.

Global & Geopolitical Developments

November 13, 2026

Europe’s Defense Boom Is Reaching Beyond Defense Companies

Share

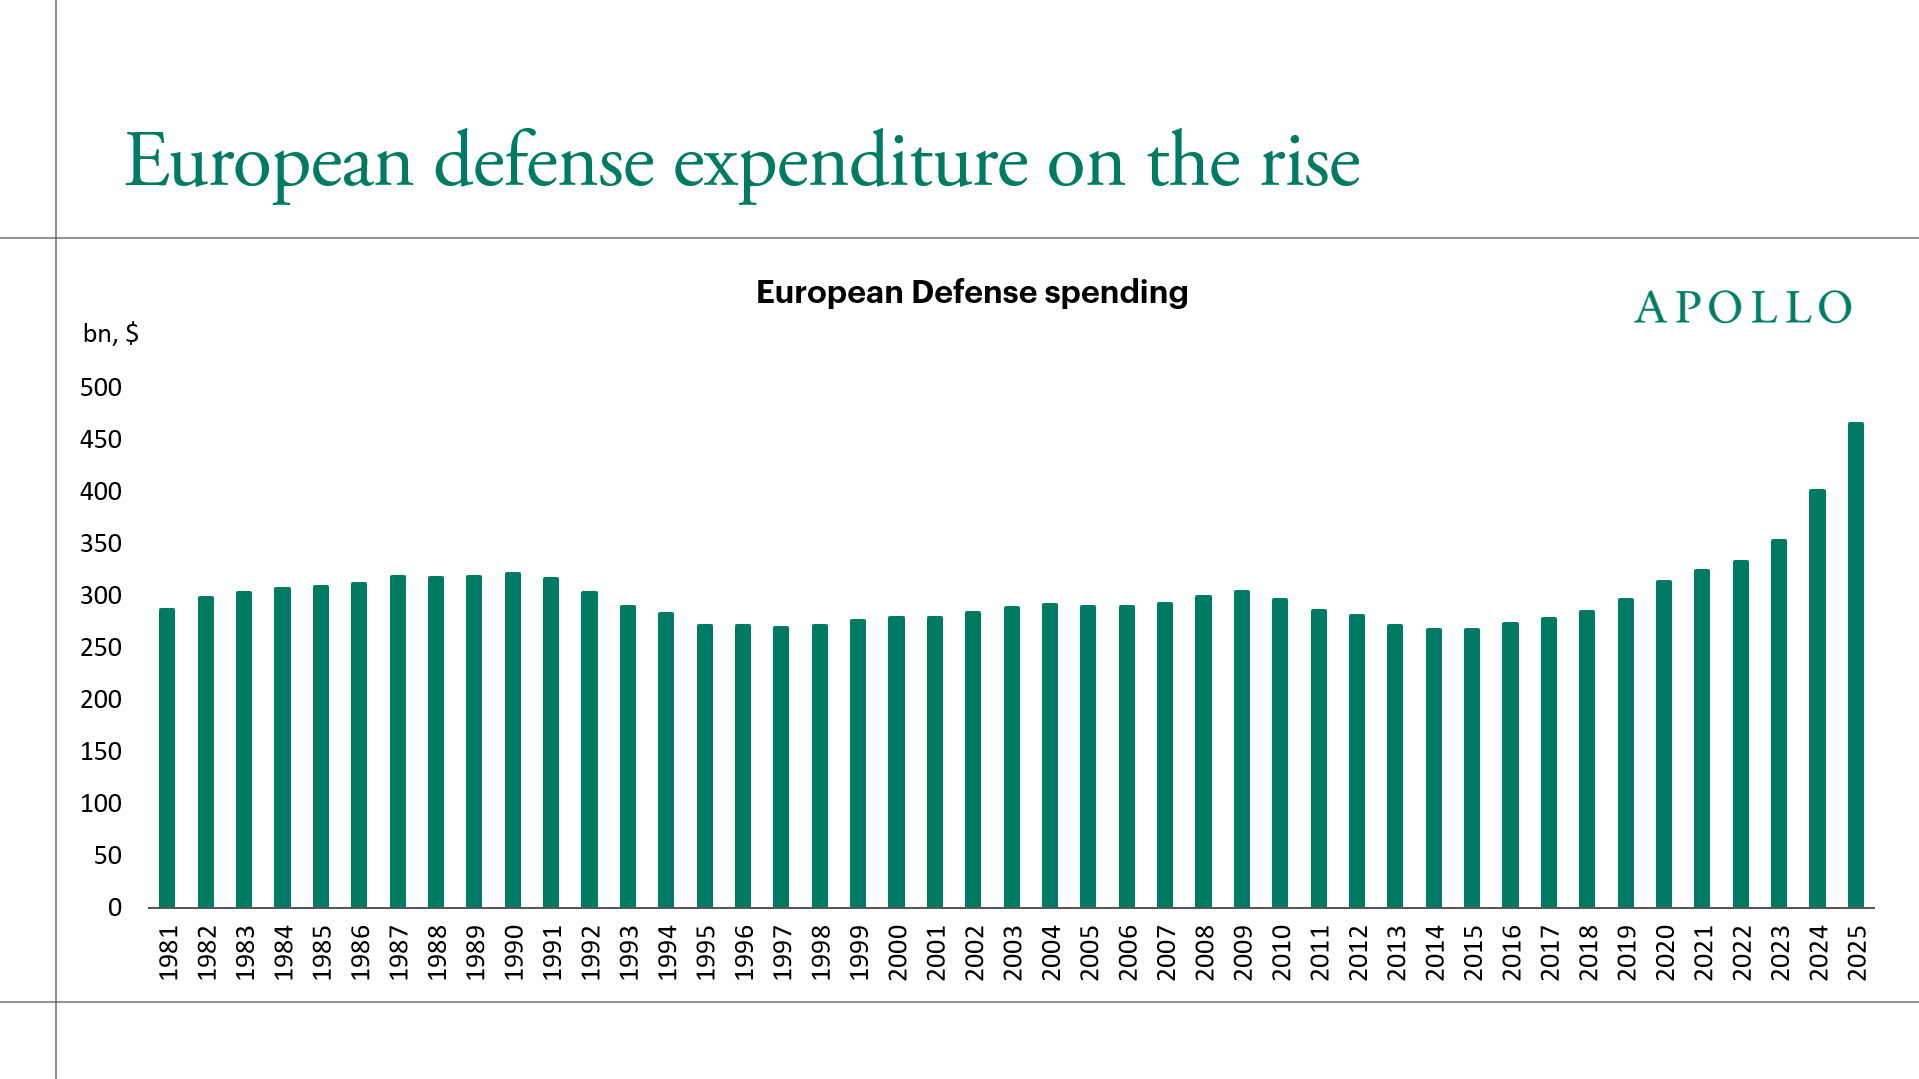
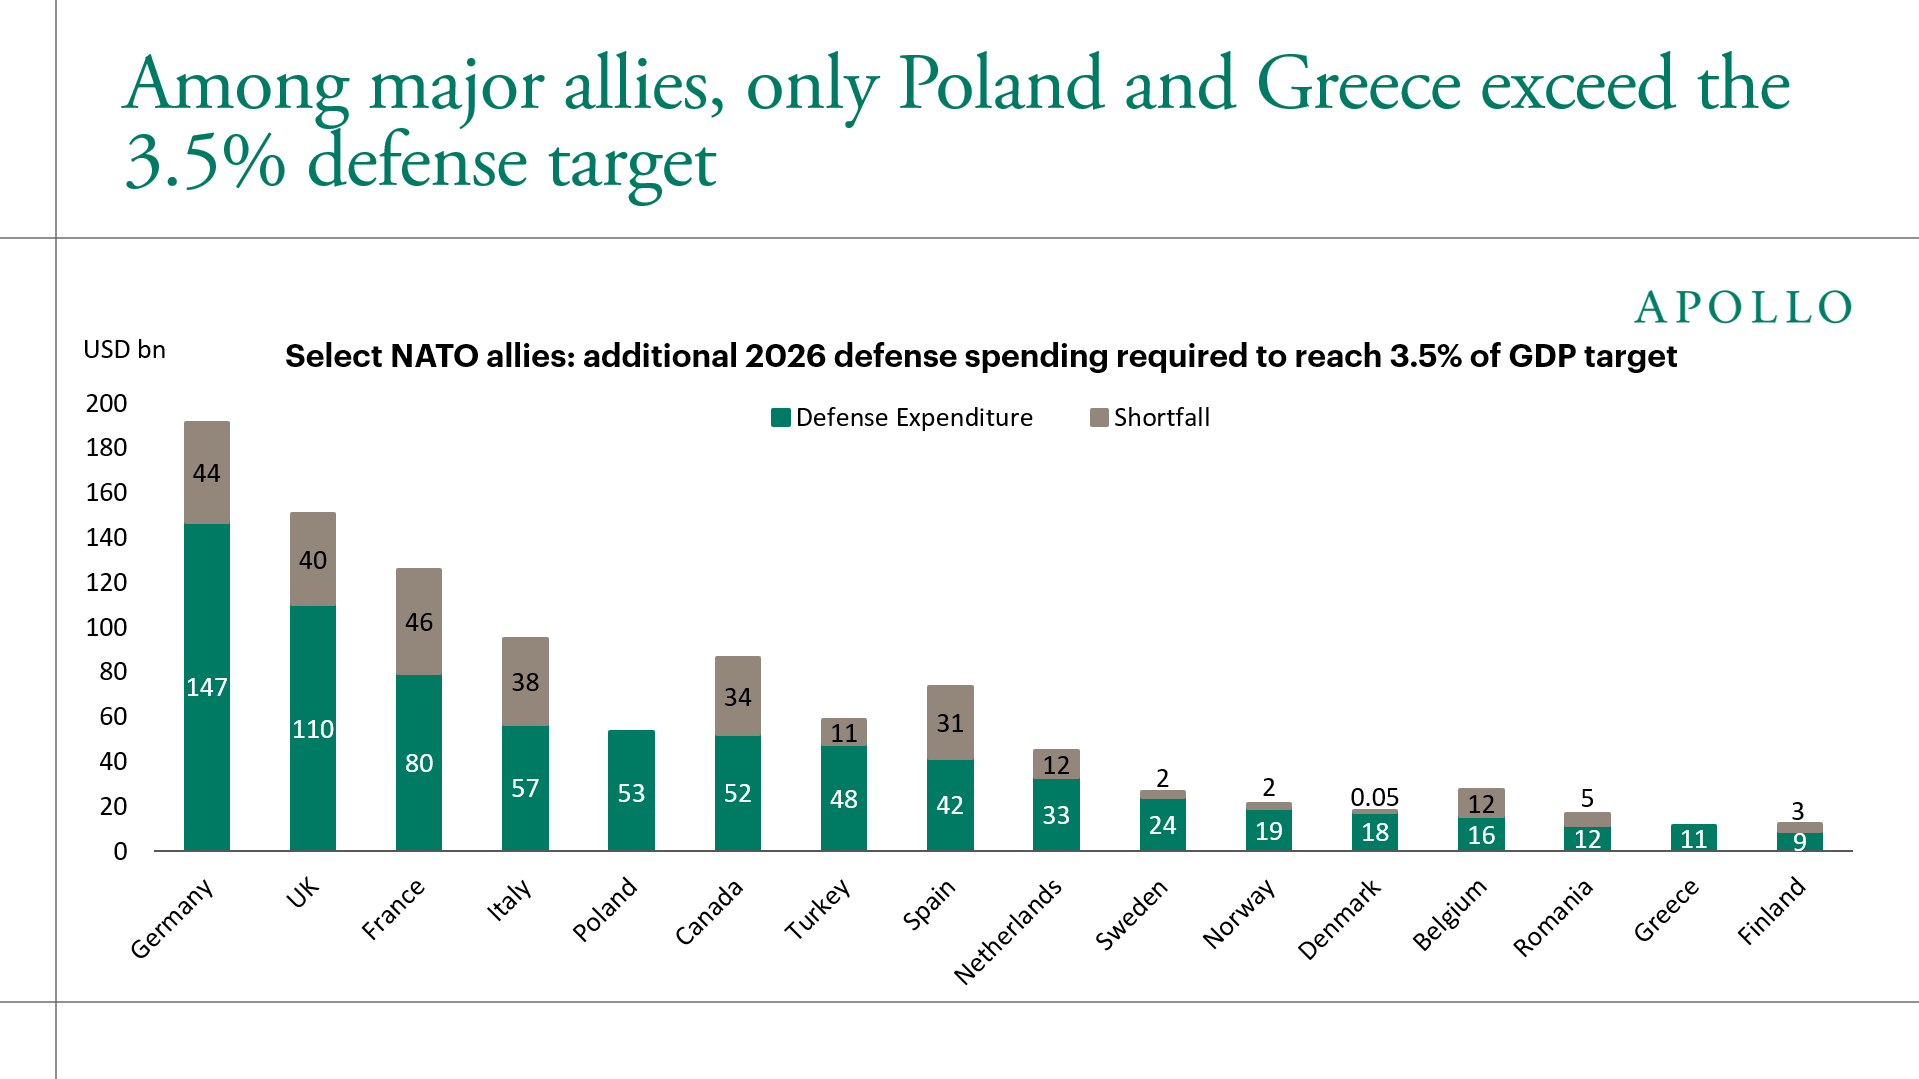
European defense spending grew 16% last year and is expected to grow at double-digit rates for the next three years, see chart below.

NATO members have committed to spend 3.5% of GDP on core defense and another 1.5% on broader security, although fiscal constraints will influence how quickly countries get there.

Recent disruptions, from attacks on subsea cables to drones near airports, to supermarket fridges and outages affecting critical infrastructure, may bring forward the need for that broader 1.5% security spending.

But where this spending goes is also broadening beyond traditional weapons and defense technology. Spending increasingly includes cybersecurity, critical infrastructure, maritime and pipeline sensors, resilient energy systems, as well as the local industrial capacity needed to manufacture and secure resilient supply chains. Many of these businesses serve both commercial and national-security markets.

The bottom line is that some of the next beneficiaries of Europe's defense buildout may sit in infrastructure, energy and industrial technology rather than in the defense sector itself.

Written by Huw van Steenis

Download high-res charts

See important disclaimers at the bottom of the page.

Macroeconomic Indicators & Trends

November 12, 2026

Higher for Longer Hits Software Refinancing

Share

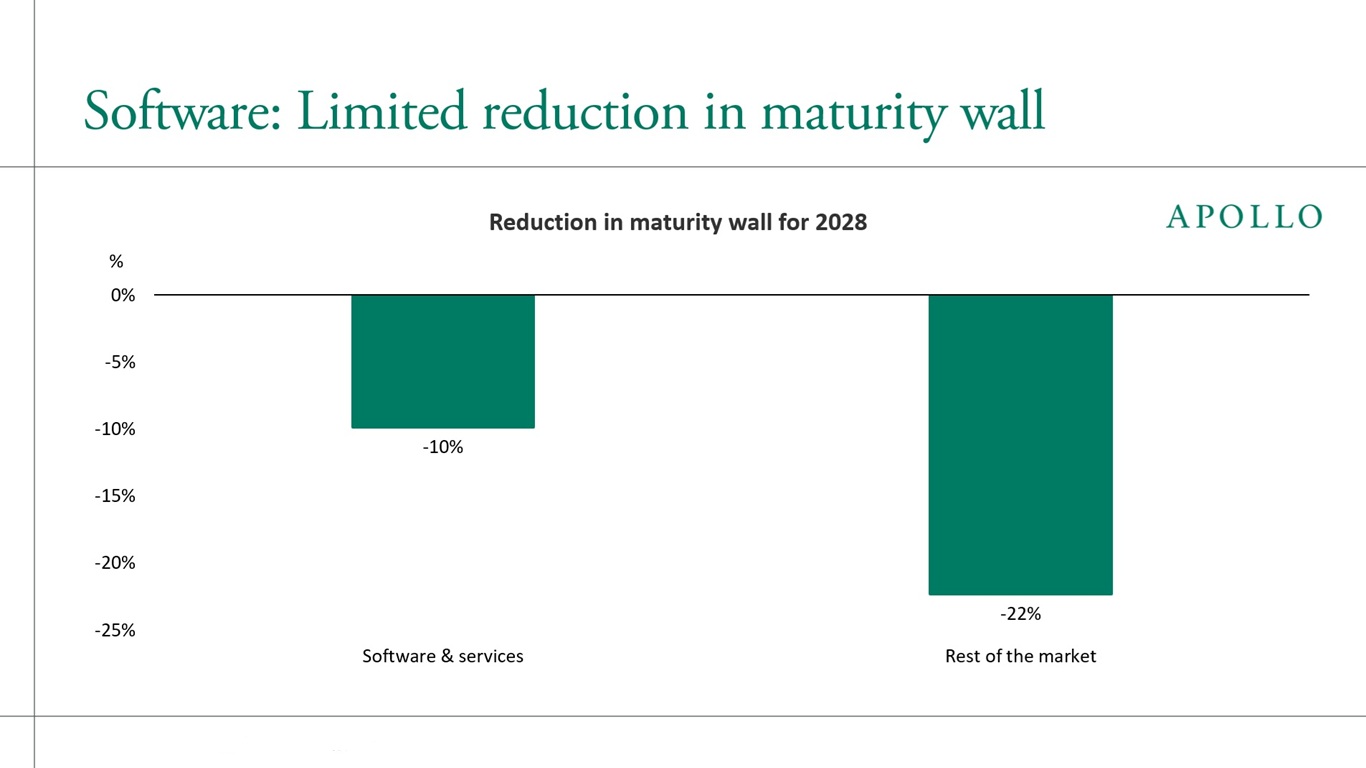
Software companies are struggling to refinance in a higher-for-longer rate environment, with the 2028 maturity wall shrinking by just 10% versus 22% for the rest of the market, see chart below.

Download high-res chart

See important disclaimers at the bottom of the page.

Macroeconomic Indicators & Trends

November 11, 2026

US Consumers Keep Spending

Share

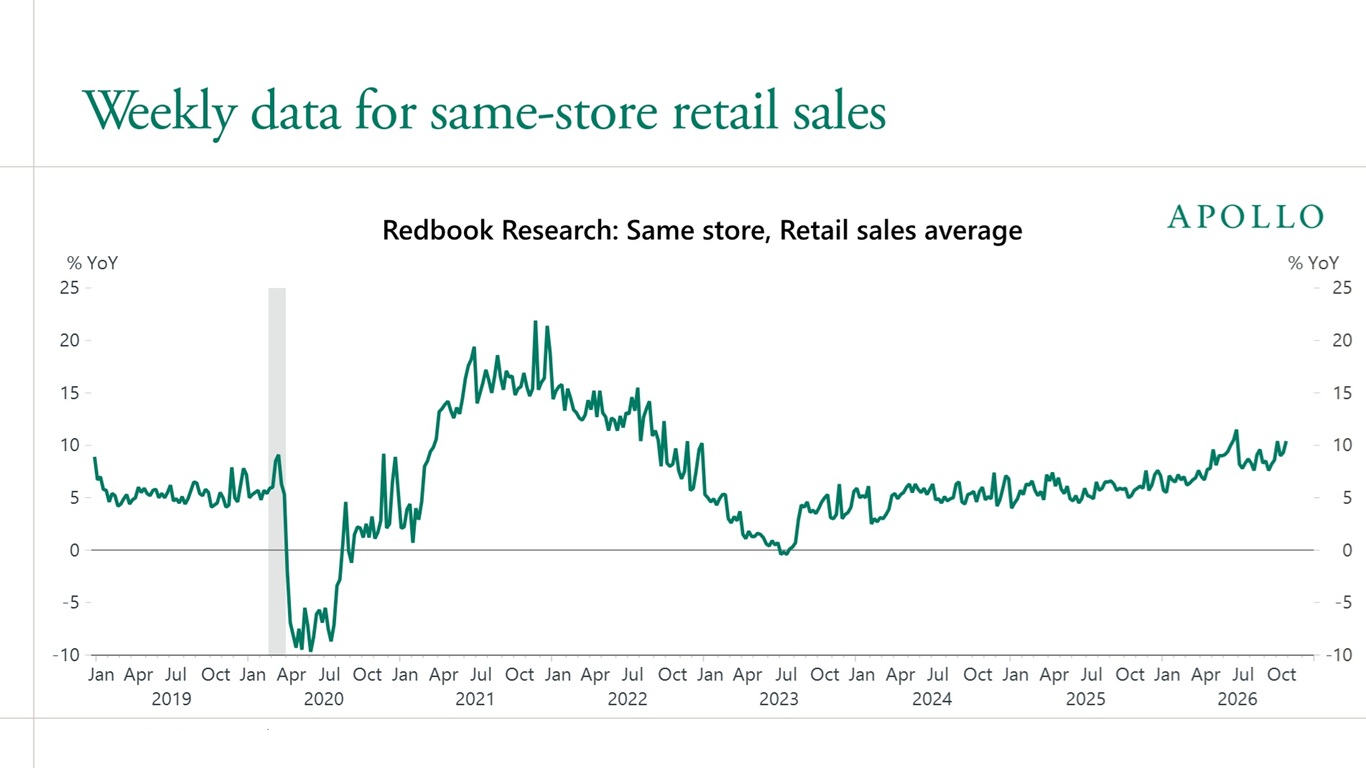
Weekly data for consumer spending continues to show strength driven by job growth for lower-income families, high asset prices and strong cash flows from fixed income for middle-income and high-income households, see the first chart below.

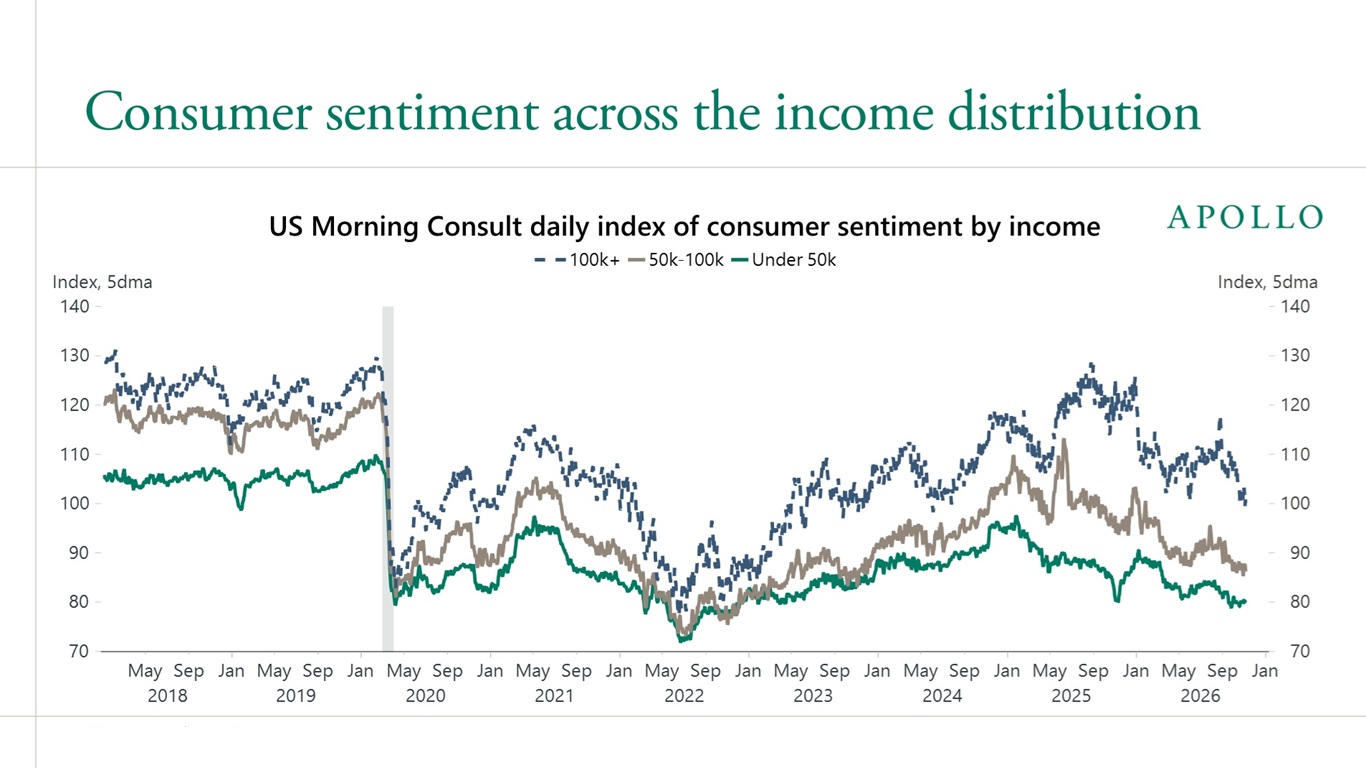
This broad-based strength in consumer spending is in sharp contrast to the ongoing decline in consumer confidence across the income distribution, see the second chart.

The bottom line is that there is a significant difference between what consumers are saying and what they are actually doing.

Download high-res charts

See important disclaimers at the bottom of the page.

No Daily Spark posts containing all your search terms were found.

Suggestions:

  • Make sure all words are spelled correctly.
  • Try different keywords.
  • Try more general keywords.

This presentation may not be distributed, transmitted or otherwise communicated to others in whole or in part without the express consent of Apollo Global Management, Inc. (together with its subsidiaries, “Apollo”).

Apollo makes no representation or warranty, expressed or implied, with respect to the accuracy, reasonableness, or completeness of any of the statements made during this presentation, including, but not limited to, statements obtained from third parties. Opinions, estimates and projections constitute the current judgment of the speaker as of the date indicated. They do not necessarily reflect the views and opinions of Apollo and are subject to change at any time without notice. Apollo does not have any responsibility to update this presentation to account for such changes. There can be no assurance that any trends discussed during this presentation will continue.

Statements made throughout this presentation are not intended to provide, and should not be relied upon for, accounting, legal or tax advice and do not constitute an investment recommendation or investment advice. Investors should make an independent investigation of the information discussed during this presentation, including consulting their tax, legal, accounting or other advisors about such information. Apollo does not act for you and is not responsible for providing you with the protections afforded to its clients. This presentation does not constitute an offer to sell, or the solicitation of an offer to buy, any security, product or service, including interest in any investment product or fund or account managed or advised by Apollo.

Certain statements made throughout this presentation may be “forward-looking” in nature. Due to various risks and uncertainties, actual events or results may differ materially from those reflected or contemplated in such forward-looking information. As such, undue reliance should not be placed on such statements. Forward-looking statements may be identified by the use of terminology including, but not limited to, “may”, “will”, “should”, “expect”, “anticipate”, “target”, “project”, “estimate”, “intend”, “continue” or “believe” or the negatives thereof or other variations thereon or comparable terminology.