Illustration of a glowing light bulb with a stylized capital “A” filament centered inside, symbolizing ideas, innovation, and insight against a green circular background.

The Daily Spark

Stay ahead of the markets with The Daily Spark at Apollo. Get exclusive, daily data-driven analysis on the US economy, inflation, and capital markets from Apollo Chief Economist Torsten Slok.
Subscribe About the Author

Not subscribed yet? Get the Daily Spark delivered to your inbox.

Subscribe
Filters
Topics
1-10 of 616 Results
Financial Markets & Risk Dynamics

September 10, 2026

Pension Reforms Key to Deeper Capital Markets

Share

Countries with larger pension systems have deeper capital markets, see chart below. The US sits at nearly 475% of GDP in pension and household investment assets, and above 200% of GDP in market capitalization. Germany, France, Italy and Spain are all well below on both measures.

What separates them is not just returns, it is the institutional bid. The Netherlands, Denmark and Sweden show what funded pension systems do for capital market depth. Ireland and Italy have now launched auto-enrollment. Germany, Europe's largest economy, is introducing reforms, see also here. Aging societies strengthen the case for creating funded pension schemes.

The bottom line is that pension depth and market depth often move together, and most of Europe has plenty of work to do. Pension funds are natural holders of equities, infrastructure, private credit, private equity and real assets. A deeper institutional savings base broadens demand and expands European markets' capacity to finance growth.

Written by Huw van Steenis, London

Download high-res chart

See important disclaimers at the bottom of the page.

Financial Markets & Risk Dynamics

September 09, 2026

Purchase Price Matters

Share

In private equity, purchase price discipline pays in every part of the cycle.

When tailwinds are strong, meaning falling rates and steadily expanding exit multiples that lift an asset's value regardless of what the owner does, a high entry price can still work out.

Those tailwinds disappear when rates stay higher for longer. Then the price you paid becomes the whole story.

That is why the cheapest quartile of buyout vintages beat the most expensive in both the 2010 to 2017 boom and the harder 2018 to 2023 stretch, see chart below.

For more, see also here.

Download high-res chart

See important disclaimers at the bottom of the page.

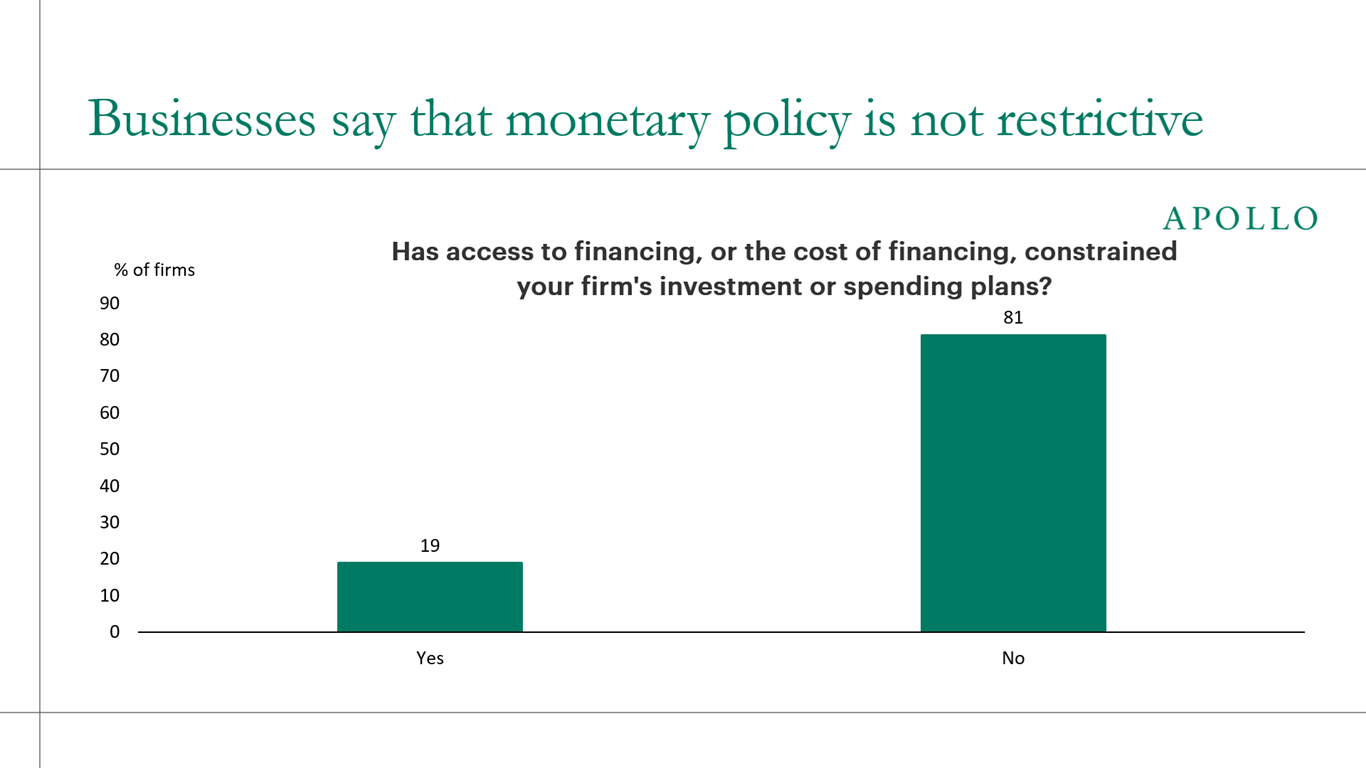
Corporate net interest payments have fallen to 0.4% of GDP because firms locked in record-low fixed rates during the pandemic. The US government did not extend the maturity of its debt outstanding when interest rates were close to zero and now pays 3.6% of GDP in net interest, see chart below.

The cost of higher rates landed on the fiscal side rather than the corporate sector, which is a key reason the tightening cycle since 2022 has failed to slow the economy.

Looking forward, however, the corporate tailwind is temporary as pandemic-era debt rolls over into higher coupons, and the impact will be most negative for highly levered borrowers in credit markets, such as software.

The bottom line is that the transmission mechanism of monetary policy was delayed rather than switched off, and it works through the same channel as always: the more debt you have, the more you are hurt by high interest rates, which is a different way of saying that high-quality companies with low leverage and actual earnings are more attractive both from a debt and equity perspective.

The Daily Spark will resume publication on Wednesday, Sept. 9.

Download high-res chart

See important disclaimers at the bottom of the page.

Multiple expansion has collapsed to just 8% of private equity value creation in 2025 from 40% before the Fed began raising rates. Value now has to be built rather than repriced, which rewards managers disciplined on entry price and focused on operations.

Download high-res chart

See important disclaimers at the bottom of the page.

Macroeconomic Indicators & Trends

September 05, 2026

Strong Jobs, Upside Risks to Next Week’s CPI

Share

This week, we not only got a strong employment report, we also saw a strong uptrend in the ISM Services Prices Paid to levels last seen during the 2021 to 2022 inflation surge, see charts below. This points to upside risks to inflation, including the CPI data next week, and we now expect the FOMC to raise interest rates at its September meeting.

Download high-res charts

See important disclaimers at the bottom of the page.

Monetary & Fiscal Policy

September 04, 2026

Germany's Pension Reform Could Generate €90 Billion of Annual Inflows

Share

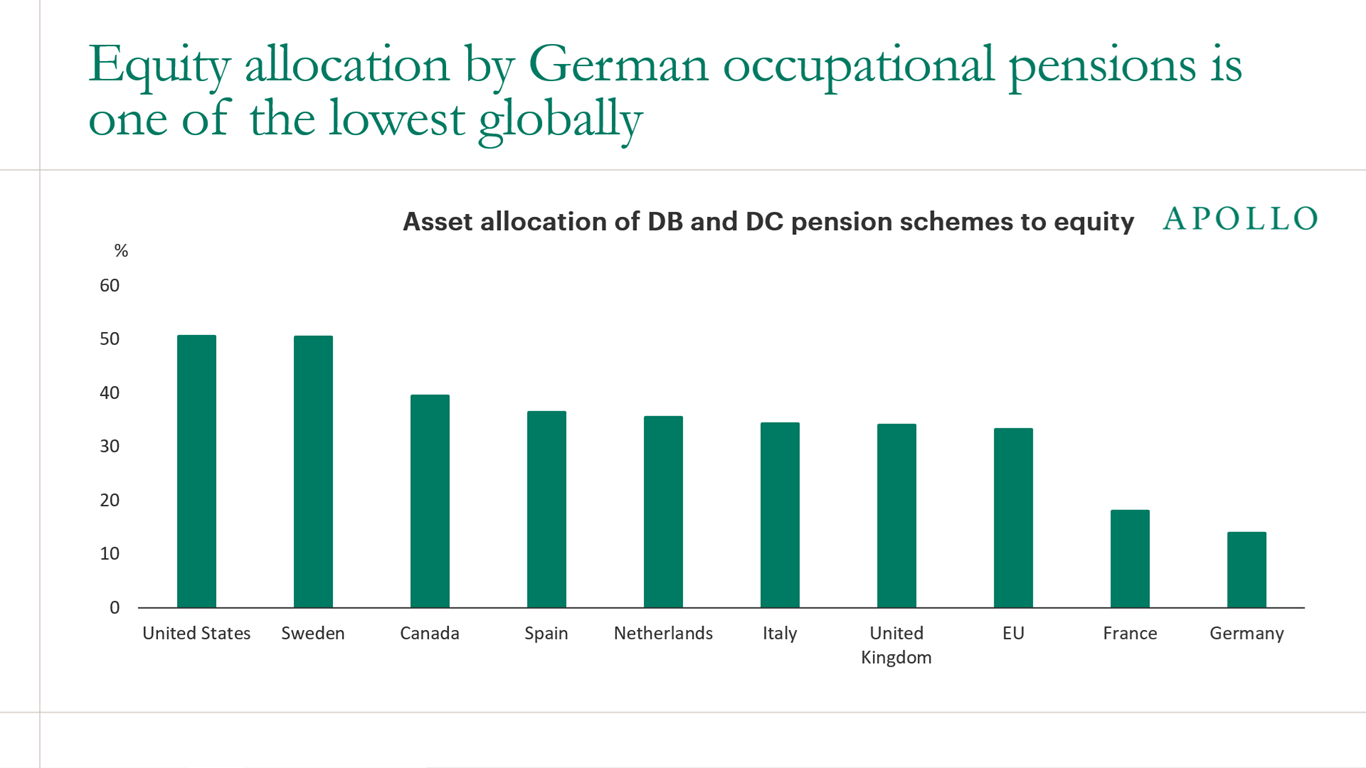
Germany has the least-funded pension system of any major advanced economy. Funded pension assets are just 7% of GDP, against 149% in Sweden and 185% in Canada, see chart below. German household wealth sits mostly in deposits.

Demographics and the desire for scaled pools of domestic capital are now forcing change.

Pension reform could channel 2% of salaries into long-term savings, 1% from employers and 1% from employees. Phased in from 2028 and completed by 2031, this points to roughly €30 billion a year flowing into Pillar 1.

Add parallel reforms to private pensions from 2027 and to occupational schemes, and total inflows could reach around €90 billion annually once fully implemented, roughly 2% of German GDP.

The bottom line is that Germany is starting to build a recurring institutional flow of capital that will deepen German capital markets.

Three things to watch: whether workers make voluntary top-ups, whether the public fund manages the money internally or outsources to external managers and whether occupational coverage broadens beyond the quarter of SMEs it reaches today.

Written by Huw van Steenis, London

Download high-res chart

See important disclaimers at the bottom of the page.

Macroeconomic Indicators & Trends

September 03, 2026

AI Is Retraining Workers, Not Replacing Them

Share

There is still no evidence that AI is replacing workers: a new survey from the New York Fed carried out in August shows that 34% of service firms and 22% of manufacturers using AI are retraining staff, while only 4% and 0% report layoffs. This is consistent with our core view that AI is putting downward pressure on wages in AI-exposed occupations without a significant negative impact on employment. For more discussion see here.

Download high-res charts

See important disclaimers at the bottom of the page.

Financial Markets & Risk Dynamics

September 02, 2026

Bessent Is Right

Share

The term premium measures the extra yield investors demand for holding a long-dated bond beyond what expectations for Fed policy alone would justify, which makes it a key market-based gauge of fiscal sustainability and Fed credibility.

Speaking at the last Treasury Market Conference, Treasury Secretary Bessent noted that the US 10-year term premium is basically unchanged. The chart below shows that this is still the case.

Specifically:

1) The New York Fed’s measure of the US 10-year term premium has moved sideways over the past 12 months. On this measure, there has been no deterioration over the past year in how the market prices US fiscal sustainability or Fed credibility.

2) The US term premium currently sits below the term premiums of Japan and Germany. This suggests that the market is less worried about the US fiscal situation compared with the fiscal situation in Germany and Japan.

The bottom line is that this chart pushes back on the idea that the US fiscal situation is having a uniquely large impact on long-term rates, or that Fed credibility is worse today than 12 months ago.

Put differently, the Fed went into 2026 expecting several cuts, and now the FOMC is leaning toward hiking. With this backdrop, it is not surprising that long rates are higher.

Download high-res chart

See important disclaimers at the bottom of the page.

Macroeconomic Indicators & Trends

September 01, 2026

US Housing Outlook: 10 Facts

Share

We have updated our 127-page US housing outlook, available here.

There are 10 conclusions:

  1. High mortgage rates at 6.7% combined with a median home price of $400,000 are holding down traffic of prospective homebuyers, see the first chart.
  2. 56% of US households can only afford a home priced below $300,000, well under the current median sales price, see the second chart.
  3. The share of first-time homebuyers is at the lowest level in decades, and the median first-time buyer is now 40 years old, up from 30 in 2008, see the third chart.
  4. Nobody is moving. The structural decline in the share of the US population changing address continues, and the share of households planning to move over the next 12 months has fallen to a record low of approximately 7%, see the fourth chart.
  5. Household formation has slowed sharply as immigration has declined, removing a key source of underlying housing demand, see the fifth chart.
  6. The typical American home is now 42 years old, and we are not building fast enough to replace the aging stock, see the sixth chart.
  7. US homes are getting smaller, with the median size of new single-family homes declining over the past decade as builders chase the price points buyers can still reach, see the seventh chart.
  8. House price inflation has stalled near 1% overall, but it is turning higher again for the most expensive homes, where buyers are least dependent on mortgage financing, see the eighth chart.
  9. Households' equity in real estate totals $35 trillion, an average of roughly $400,000 per owner-occupied home, see the ninth chart.
  10. Delinquency rates on multifamily housing have climbed above their post-GFC peak to the highest level since at least 2004, see the tenth chart.
Download high-res chart book

See important disclaimers at the bottom of the page.

Macroeconomic Indicators & Trends

August 31, 2026

Undervalued in Burgers, Overvalued in iPhones

Share

The Big Mac index measures currency valuation by comparing the price of an identical burger across countries. By that measure, the Brazilian real and Egyptian pound look deeply undervalued against the dollar, by 20% to 55%, see charts below.

But swap the burger for an iPhone 17 Pro with 256GB, and the picture inverts. The same phone costs 90% more in Brazil and 55% more in Egypt than it does in the US.

The difference is what goes into each product.

A burger is assembled from local labor, local rent and local beef, none of which can be arbitraged across borders, while an iPhone is a genuinely global good built from one supply chain at one dollar cost.

The bottom line is that the iPhone index is the better read on currency valuation, because the Big Mac's core weakness is the one Balassa and Samuelson identified 60 years ago. Productivity gains in rich countries lift wages economy-wide, including in the kitchen, so poor countries look cheap by construction rather than because their currencies are genuinely undervalued.

Download high-res charts

See important disclaimers at the bottom of the page.

This presentation may not be distributed, transmitted or otherwise communicated to others in whole or in part without the express consent of Apollo Global Management, Inc. (together with its subsidiaries, “Apollo”).

Apollo makes no representation or warranty, expressed or implied, with respect to the accuracy, reasonableness, or completeness of any of the statements made during this presentation, including, but not limited to, statements obtained from third parties. Opinions, estimates and projections constitute the current judgment of the speaker as of the date indicated. They do not necessarily reflect the views and opinions of Apollo and are subject to change at any time without notice. Apollo does not have any responsibility to update this presentation to account for such changes. There can be no assurance that any trends discussed during this presentation will continue.

Statements made throughout this presentation are not intended to provide, and should not be relied upon for, accounting, legal or tax advice and do not constitute an investment recommendation or investment advice. Investors should make an independent investigation of the information discussed during this presentation, including consulting their tax, legal, accounting or other advisors about such information. Apollo does not act for you and is not responsible for providing you with the protections afforded to its clients. This presentation does not constitute an offer to sell, or the solicitation of an offer to buy, any security, product or service, including interest in any investment product or fund or account managed or advised by Apollo.

Certain statements made throughout this presentation may be “forward-looking” in nature. Due to various risks and uncertainties, actual events or results may differ materially from those reflected or contemplated in such forward-looking information. As such, undue reliance should not be placed on such statements. Forward-looking statements may be identified by the use of terminology including, but not limited to, “may”, “will”, “should”, “expect”, “anticipate”, “target”, “project”, “estimate”, “intend”, “continue” or “believe” or the negatives thereof or other variations thereon or comparable terminology.