


Topics
1-10 of 501 Results
Macroeconomic Indicators & Trends

Torsten
Slok
May 17, 2026
Why G7 Government Bond Yields Are at Their Highest Levels Since 2004
The chart below shows that G7 government bond yields have surged to their highest levels in more than 20 years, driven by:
1) renewed inflationary pressure from elevated energy prices as the Middle East conflict disrupts global oil supply,
2) persistently large government deficits requiring ever-increasing bond issuance,
3) the end of central bank quantitative easing with the Fed balance sheet potentially shrinking, and
4) investors demanding higher term premiums and inflation premiums amid deglobalization and increased geopolitical fragmentation.
With no clear resolution in sight on any of these fronts, the era of artificially suppressed yields appears firmly behind us.
In short, rates will stay higher for longer, and investors should plan accordingly.
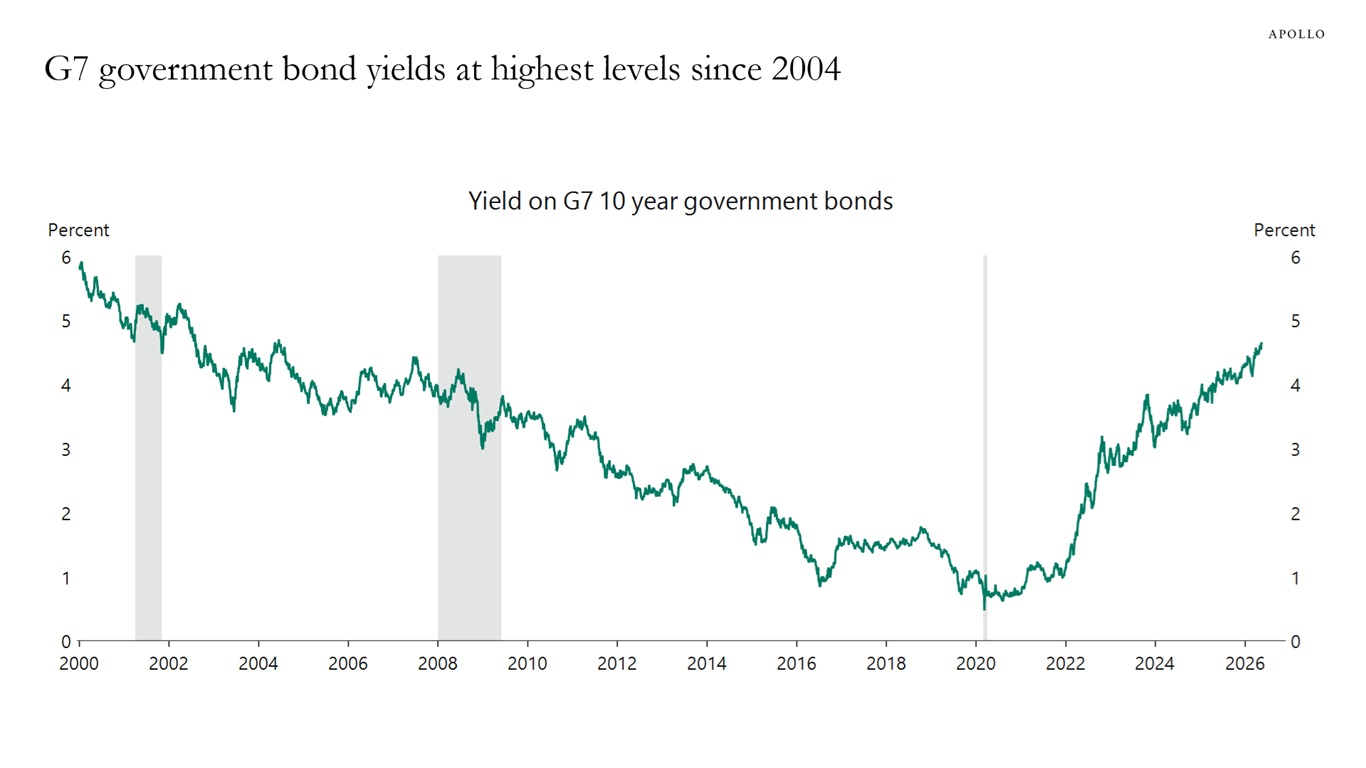
Note: Maturity is 10 years and higher. Sources: ICE BofAML, Macrobond, Apollo Chief Economist
See important disclaimers at the bottom of the page.
Macroeconomic Indicators & Trends
Torsten
Slok
May 16, 2026
America's Data Center Count Is About to Nearly Double
In the US, there are roughly 4,000 existing data centers, and there are almost 3,000 data centers under construction, see chart below.
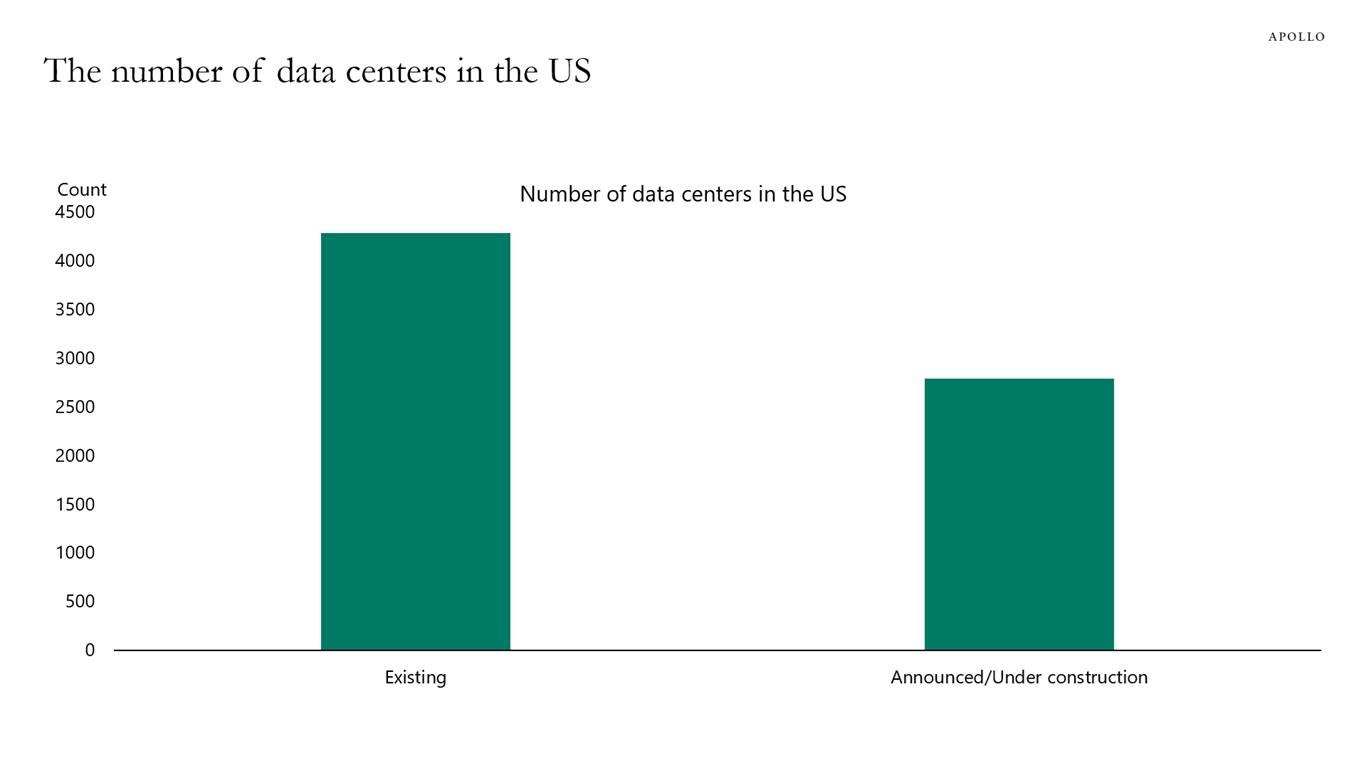
Sources: Americas-AI-Surge-Powering-Growth-in-Every-State.pdf, Data Centers – Database, Apollo Chief Economist
See important disclaimers at the bottom of the page.
Macroeconomic Indicators & Trends
Torsten
Slok
May 15, 2026
Financial Stresses Easing for Households
The share of consumers who expect to miss a minimum debt payment in the next three months just hit its lowest level in several years, a quiet but meaningful sign that financial stress is easing. The bottom line is that households are feeling better about their finances.
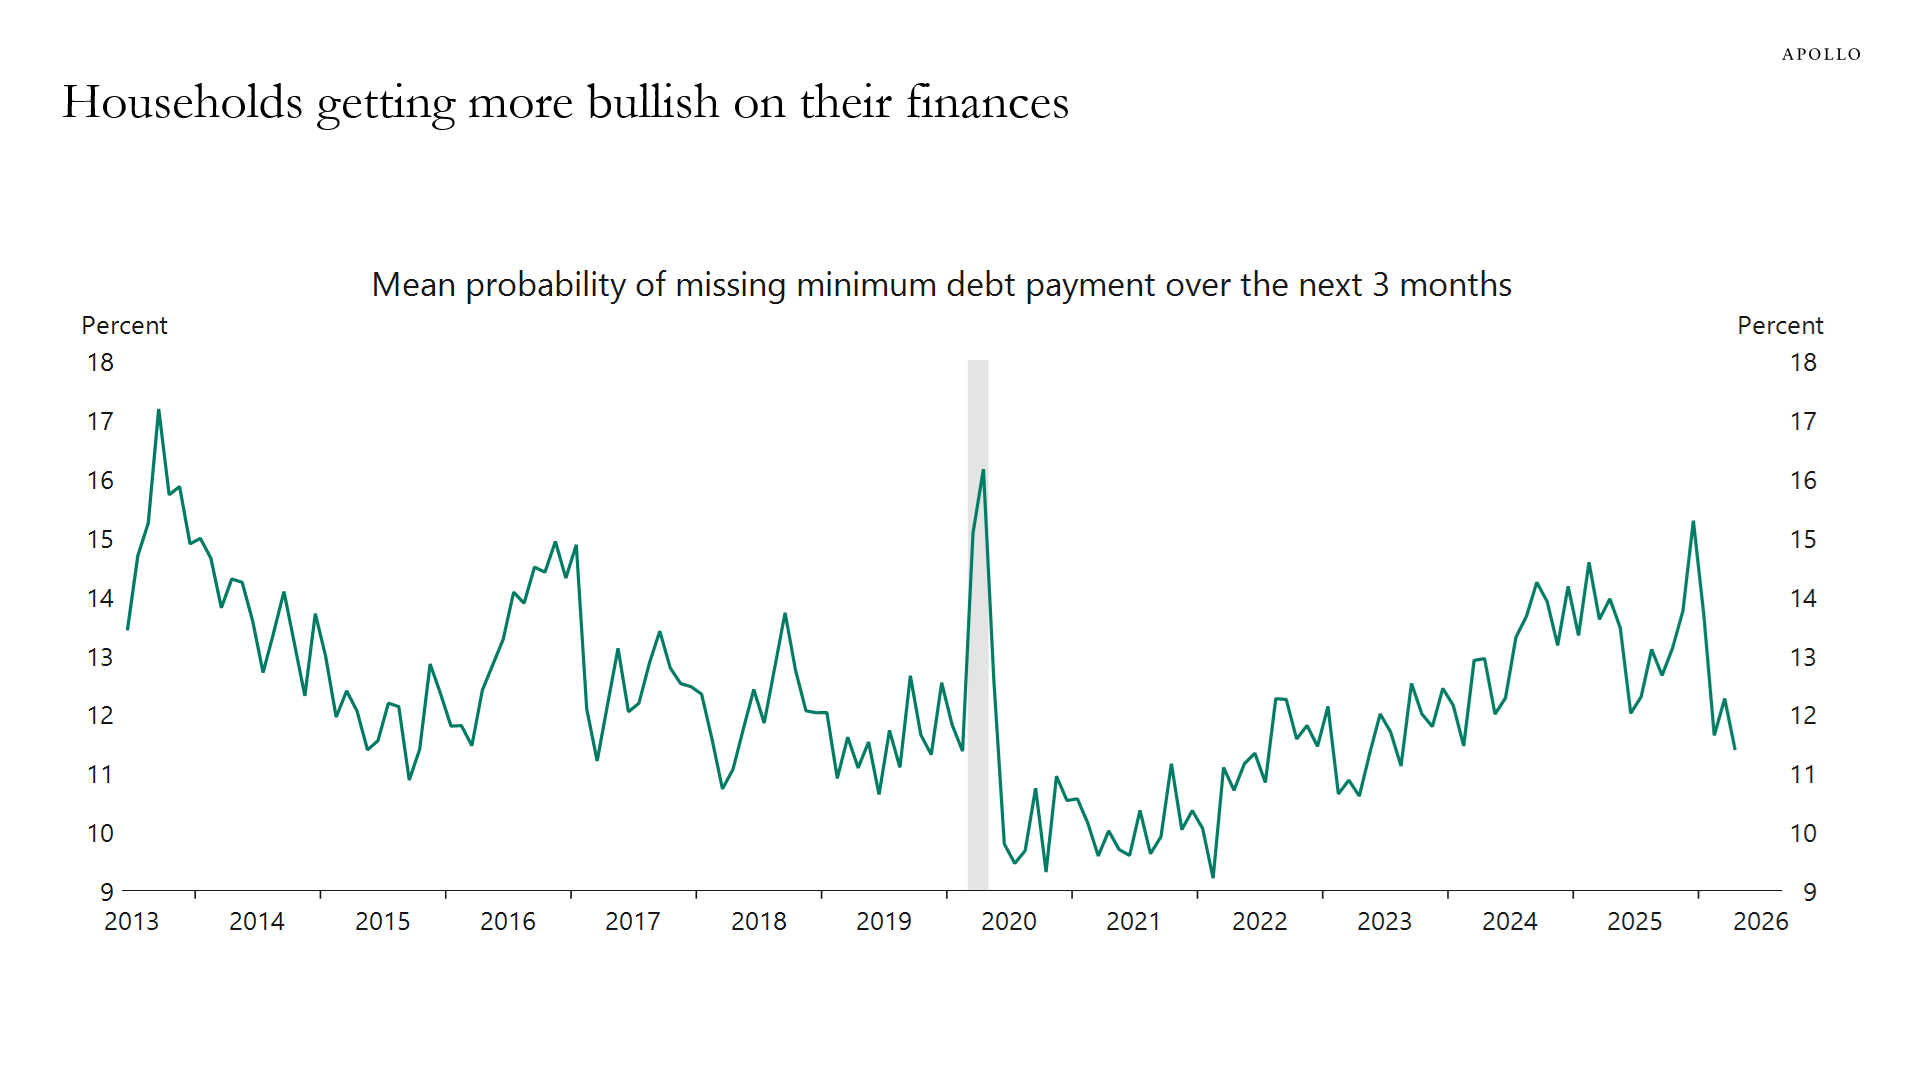
Sources: Federal Reserve Bank of New York, Macrobond, Apollo Chief Economist
See important disclaimers at the bottom of the page.
The parallels with the energy shocks in the 1970s are worrying, see chart below and here. The last mile of fighting inflation is a marathon rather than a sprint. Combined with the ongoing fiscal challenges, the bottom line is that there are a lot of upward pressures on rates across the curve, see also here.
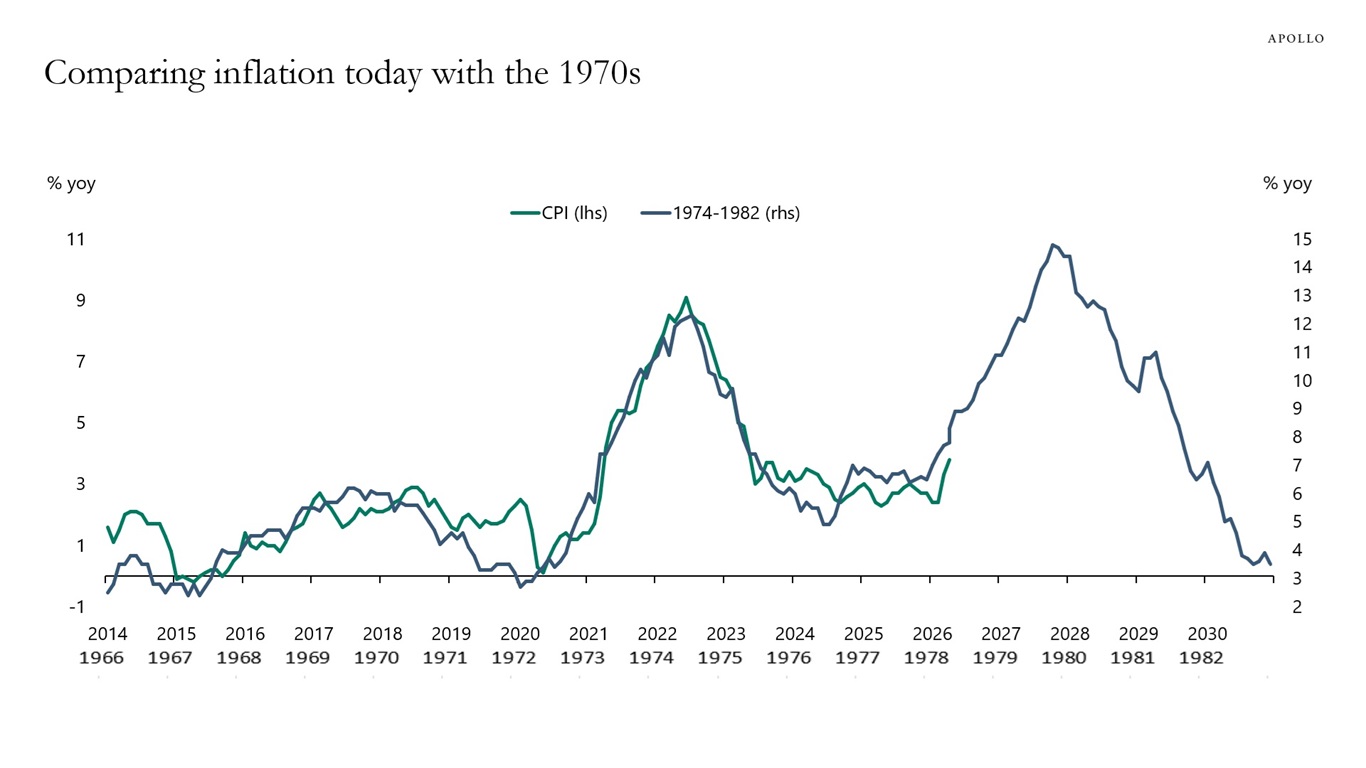
Sources: Bloomberg, BEA, Apollo Chief Economist
See important disclaimers at the bottom of the page.
Monetary & Fiscal Policy
Torsten
Slok
May 13, 2026
US Government Finances Are Not Ready for a Recession
During US recessions, the budget deficit typically widens by around 4% of GDP as unemployment benefits surge and tax revenues collapse, see here.
That would be manageable if the US were entering a potential recession from a position of fiscal strength. It is not. In fact, the US has never entered a recession with this little fiscal buffer, see chart below.
The investment implication is clear: do not expect lower interest rates to bail out valuations. The standard recession playbook that growth slows, the Fed cuts, rates fall and multiples expand breaks down when the sovereign borrower is already stretched.
In the front end, inflation driven by higher energy prices, tariffs and immigration restrictions is proving stickier than the Fed expected, constraining how aggressively it can cut. At the long end, the fiscal trajectory is structurally bearish for bonds. Treasury is already funding record deficits almost entirely through T-bills to avoid putting upward pressure on long yields, a strategy that cannot continue indefinitely. When coupon issuance eventually has to increase, the supply shock will push long yields higher, not lower. And in a recession, the deficit blows out further, requiring even more issuance at precisely the moment when market appetite for duration is most uncertain, see also here.
The bottom line is that rates are staying higher for longer across the curve, and the traditional path to value creation through multiple expansion is largely closed. Value will have to come from the hard work of operational improvement, i.e., earnings growth, margin expansion and cash generation, and not from the discount rate doing investors a favor.
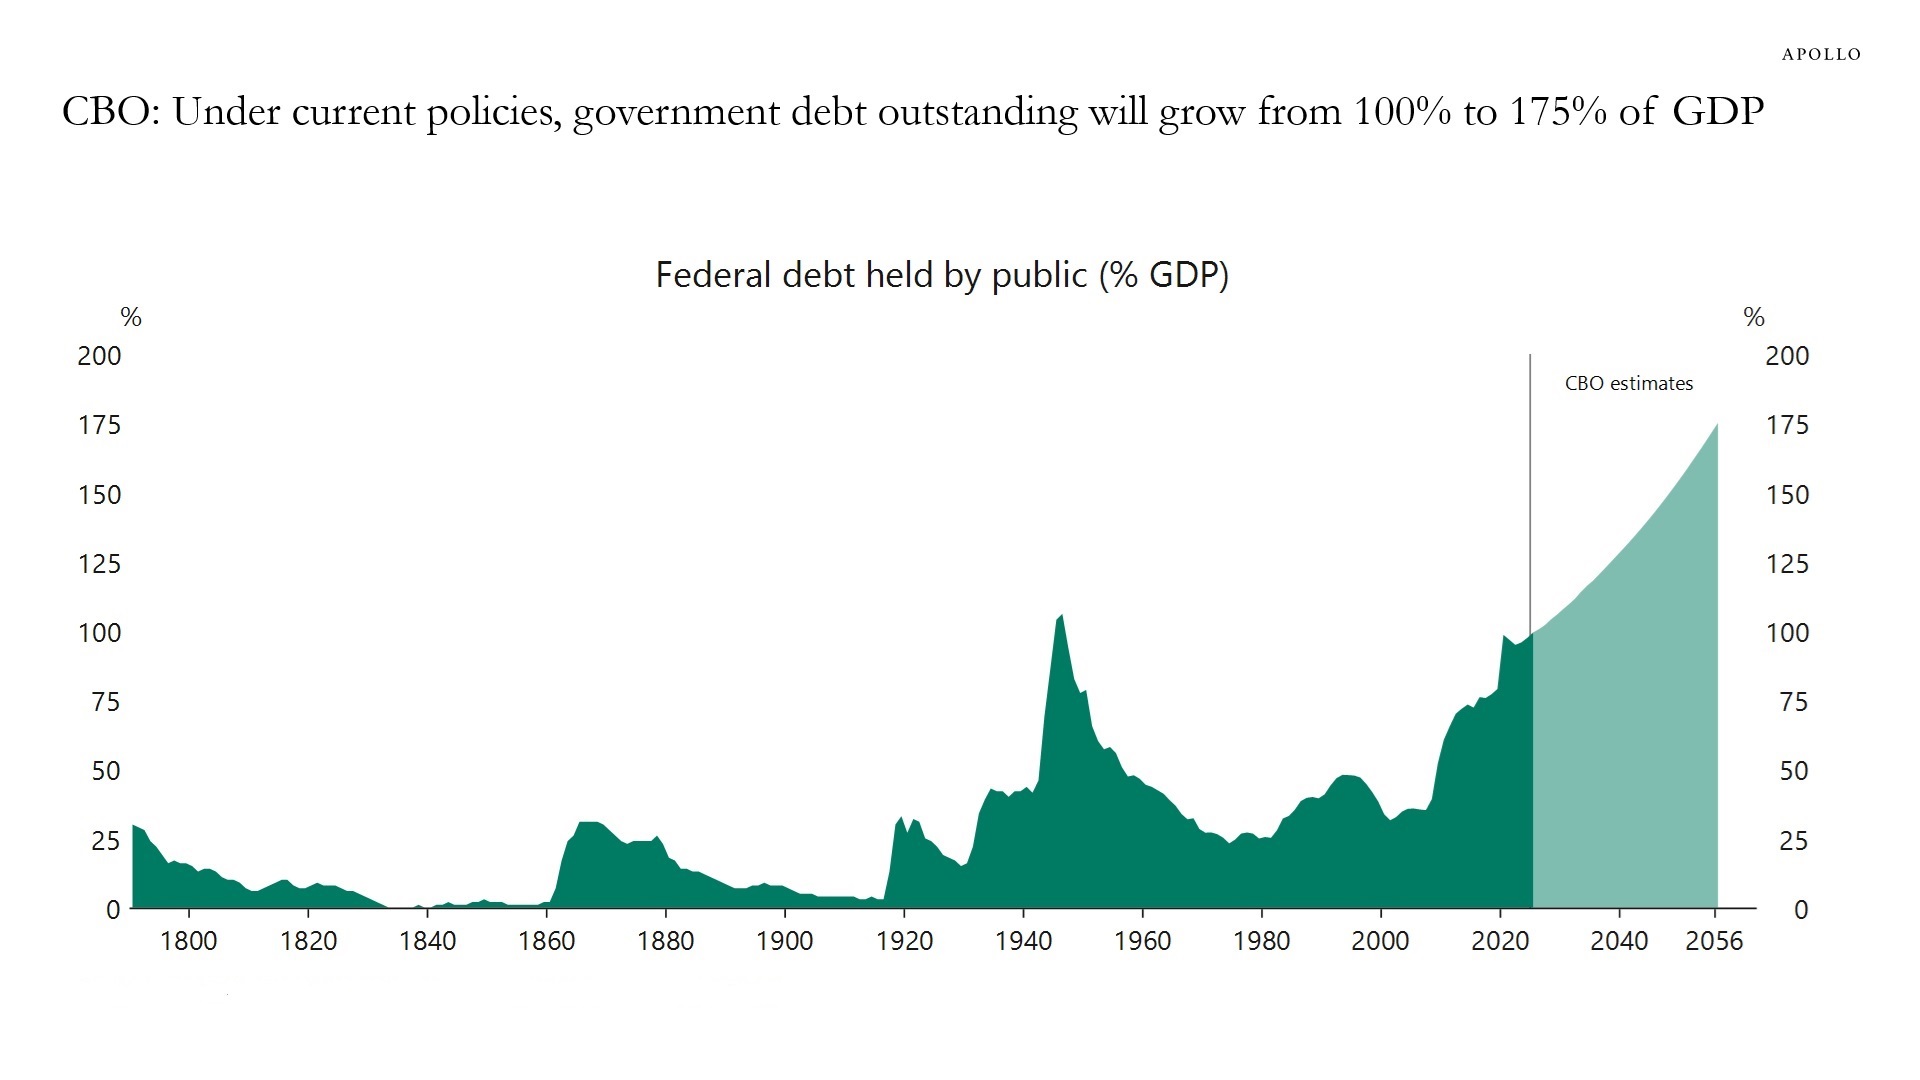
Sources: Congressional Budget Office (CBO), Macrobond, Apollo Chief Economist
See important disclaimers at the bottom of the page.
Financial Markets & Risk Dynamics
Torsten
Slok
May 12, 2026
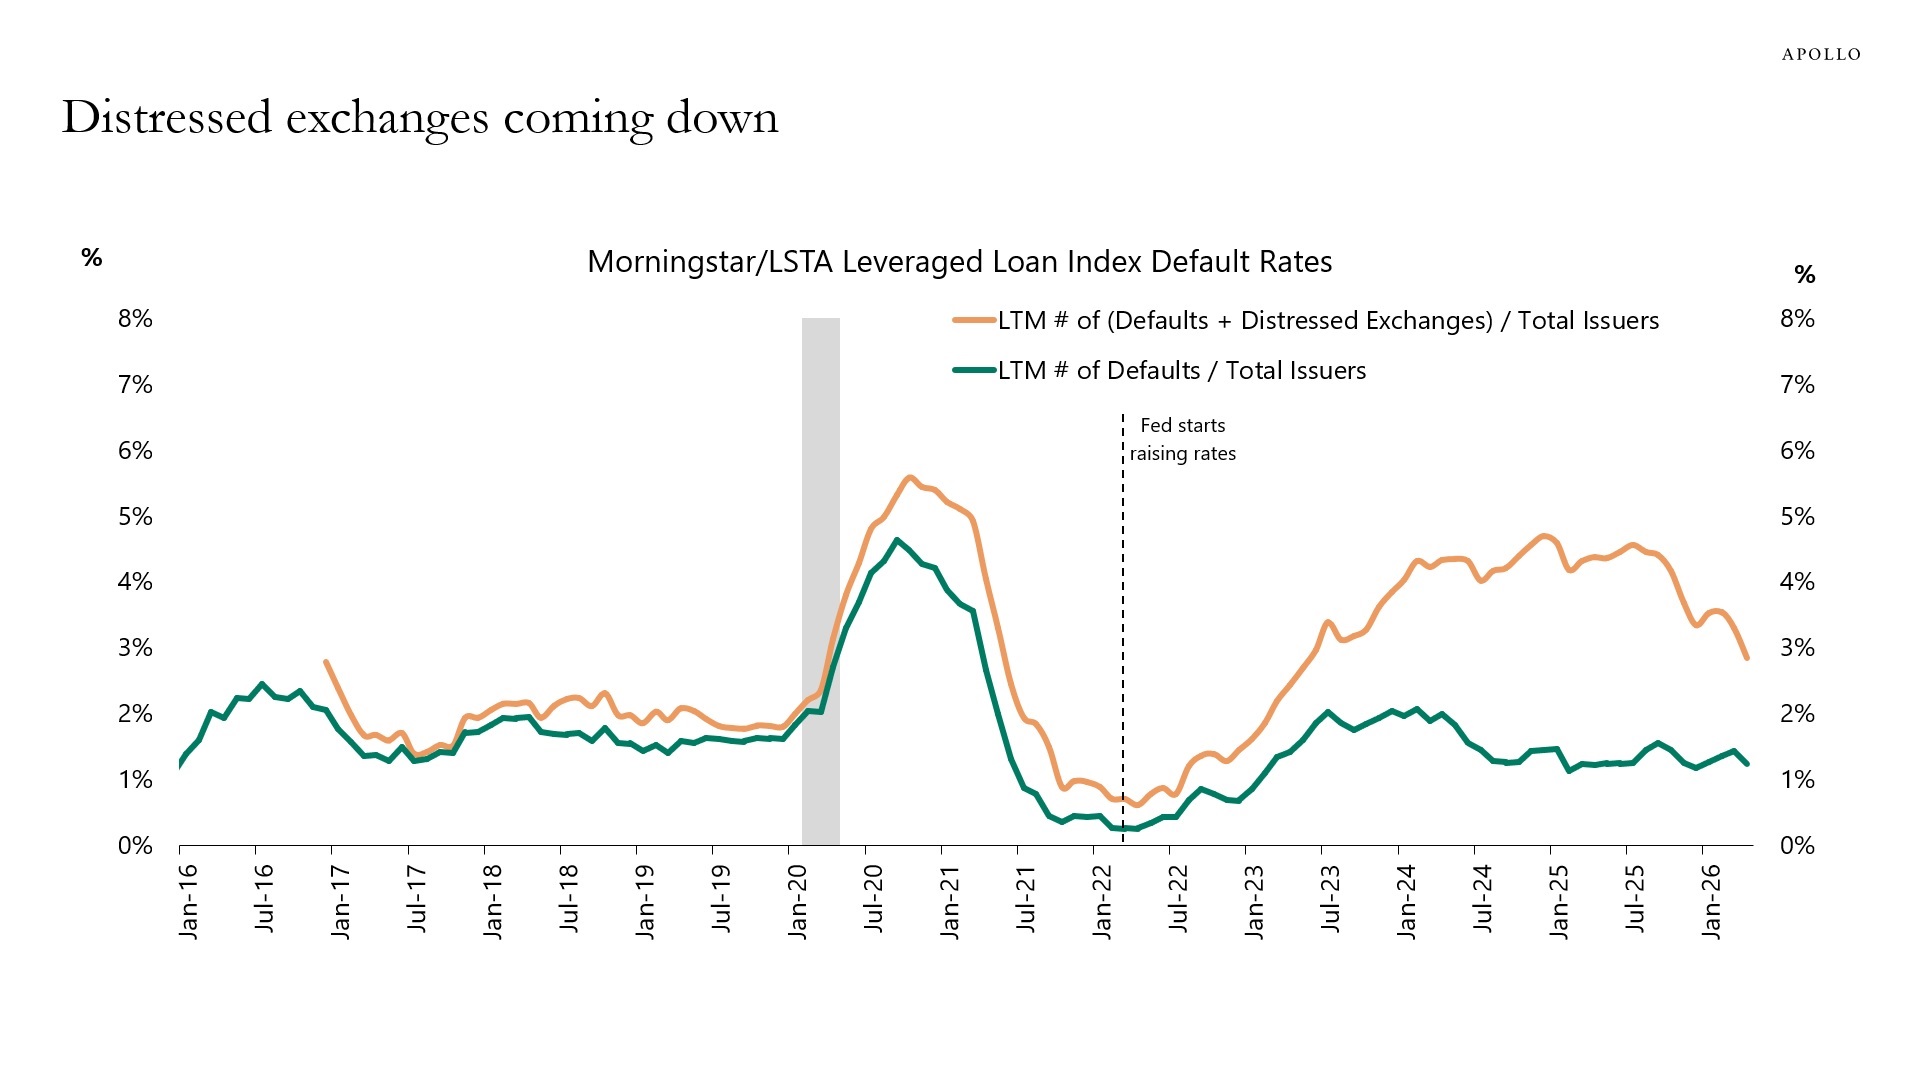
In Credit Markets, Things Are Getting Better, Not Worse
Default rates are falling, distressed exchanges are declining and the number of liability management exercises are declining, see charts below.
The bottom line is that the economy is strong and there are no signs of a full-blown credit cycle.
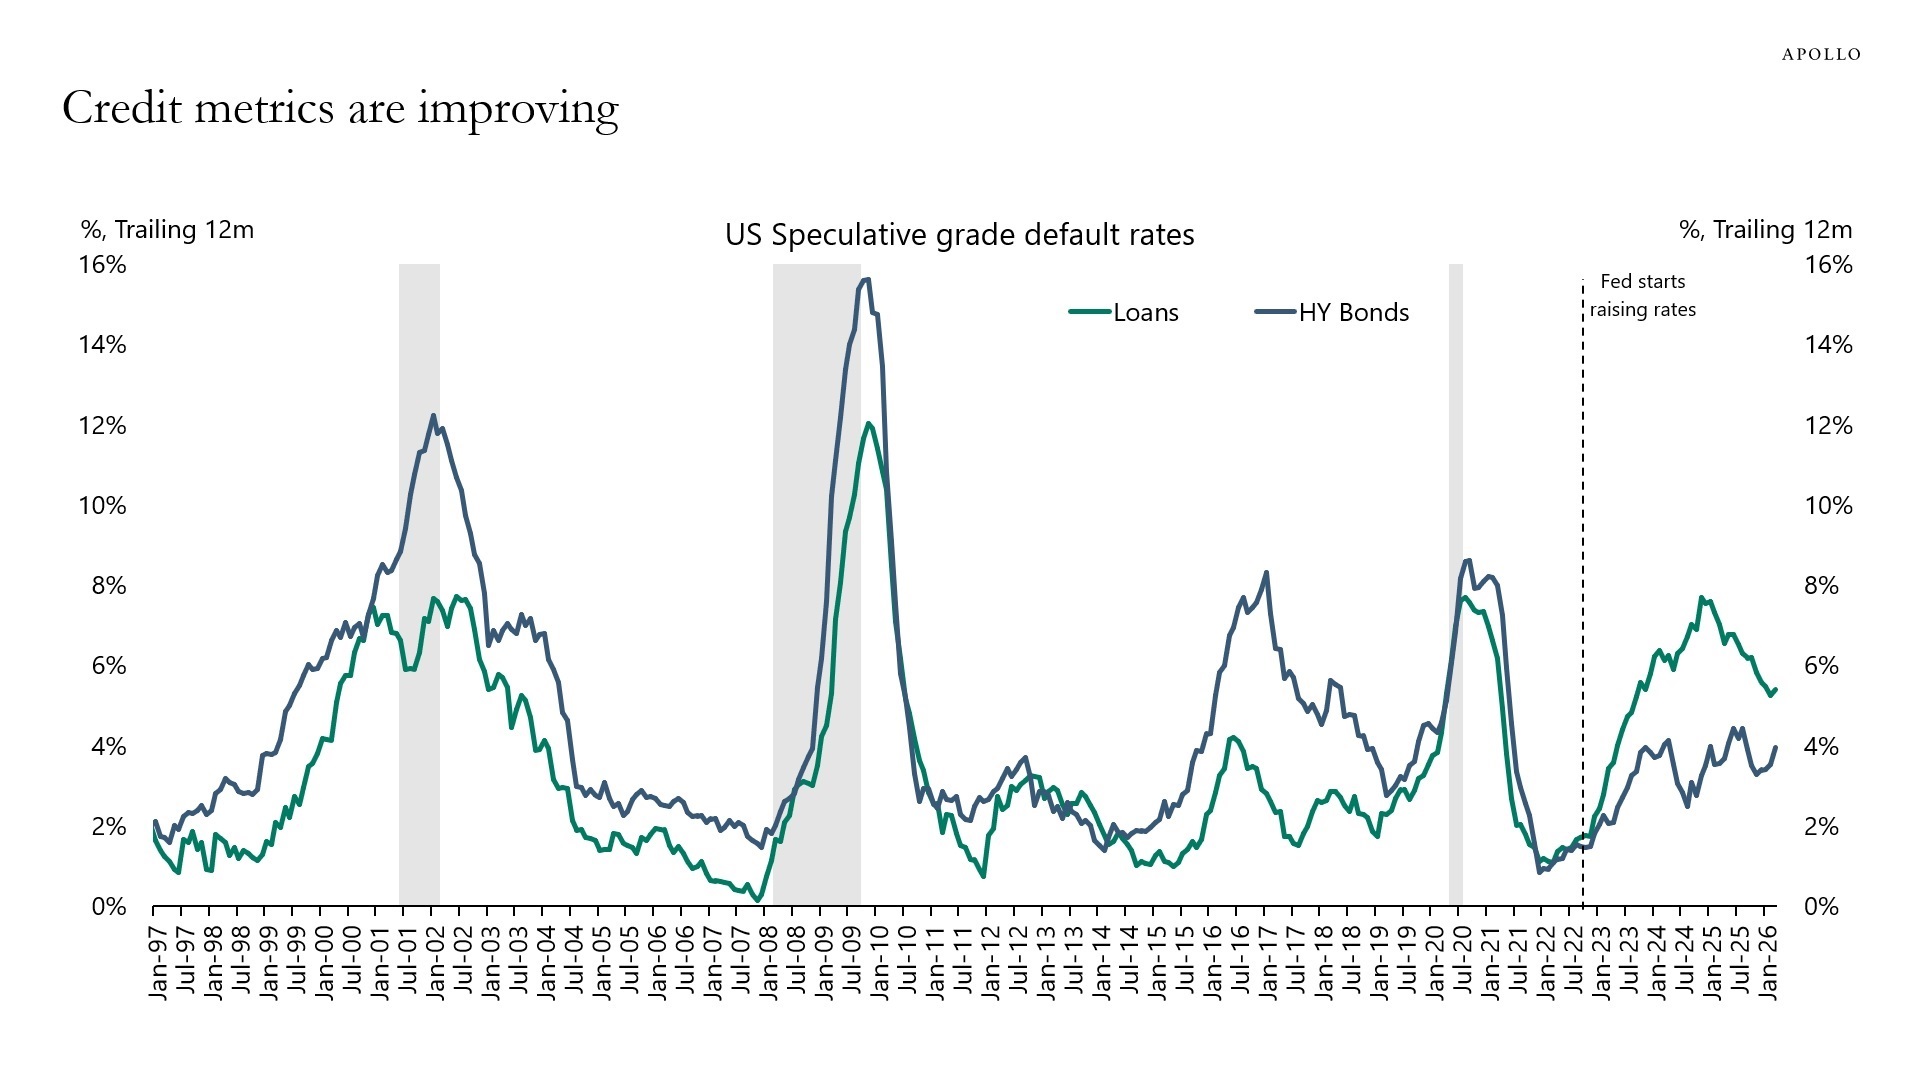
Sources: Moody’s Analytics, Apollo Chief Economist
Note: LTM = Last 12 months. Sources: PitchBook, Apollo Chief Economist
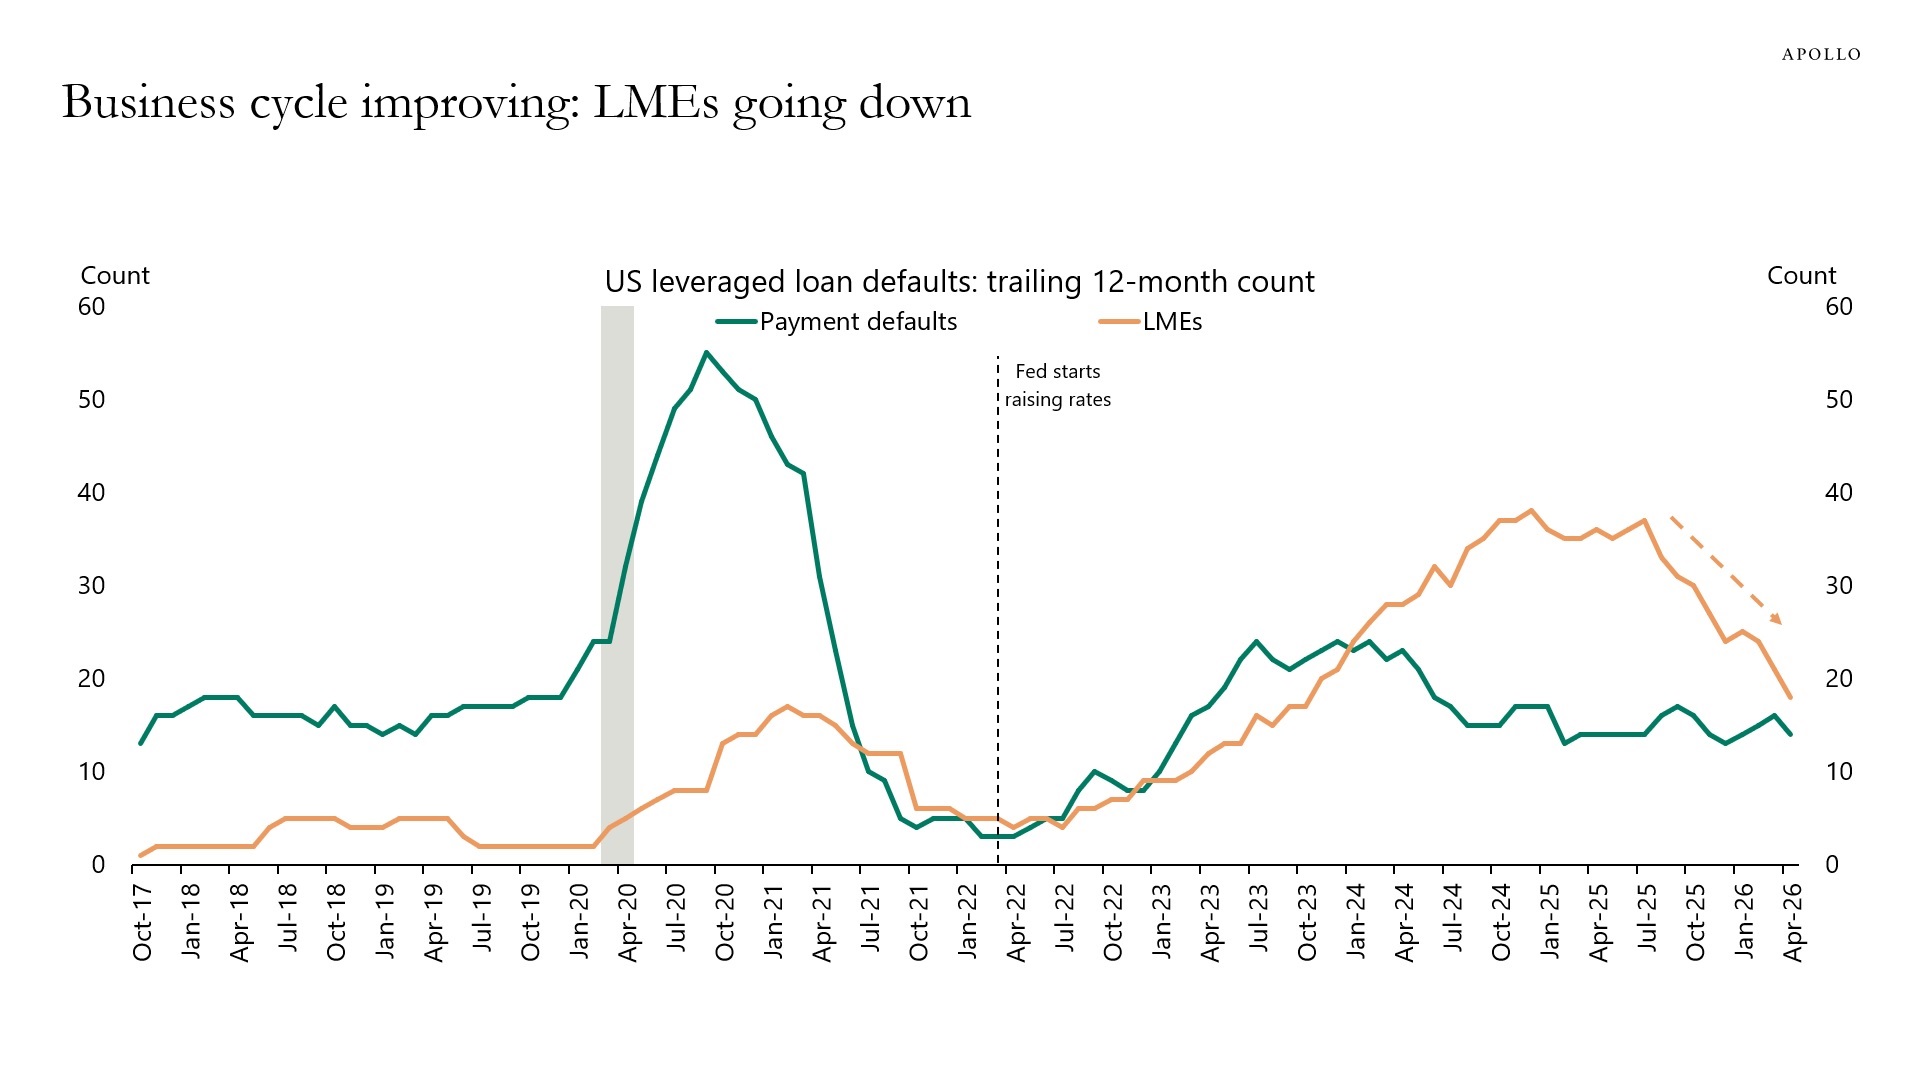
LME: Liability management exercise. Sources: PitchBook LCD, Apollo Chief Economist
See important disclaimers at the bottom of the page.
The chart below shows that pharma and insurance are dominated by large companies, while services and construction are dominated by smaller companies.
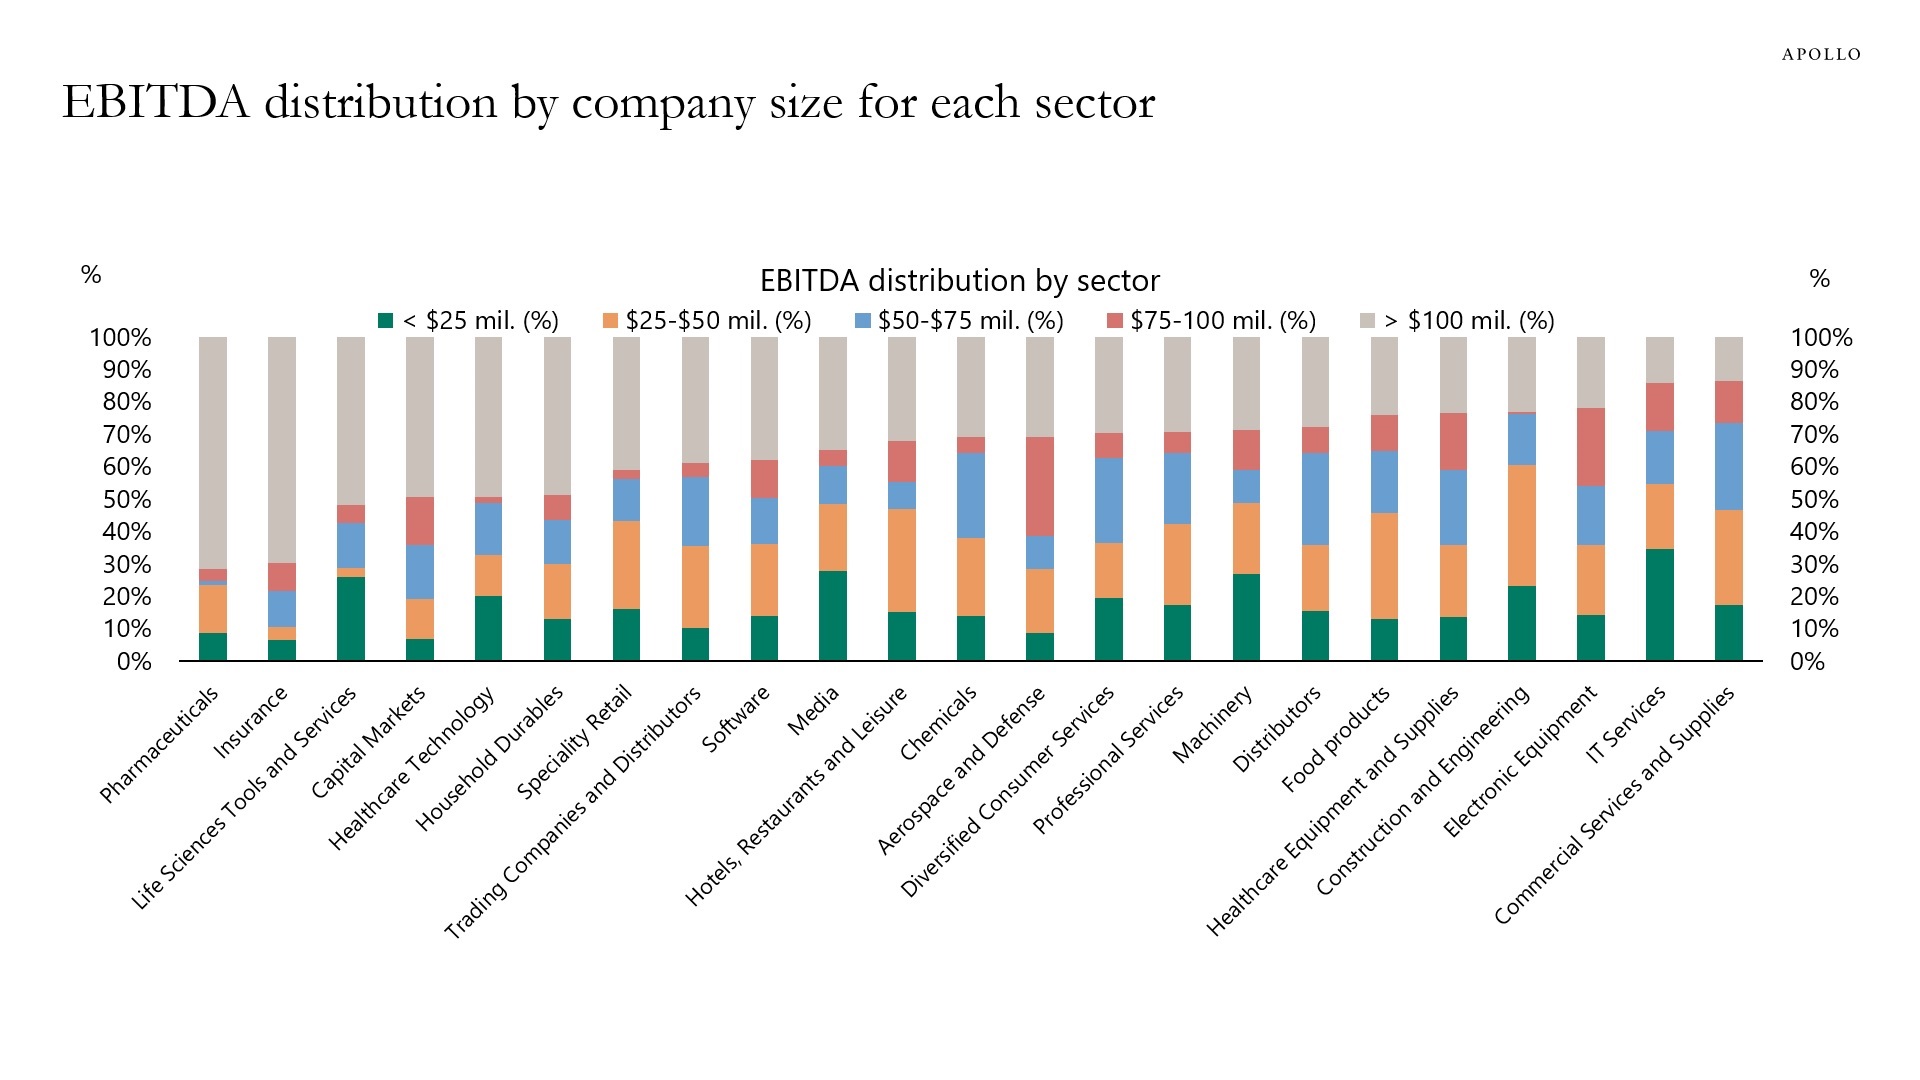
Sources: S&P Ratings, Apollo Chief Economist
See important disclaimers at the bottom of the page.
Macroeconomic Indicators & Trends
Torsten
Slok
May 10, 2026
Record High Number of 18-Year-Olds in the US Today
America is at peak 18, and the number of 18-year-olds will fall 14% over the coming decade, see chart below.
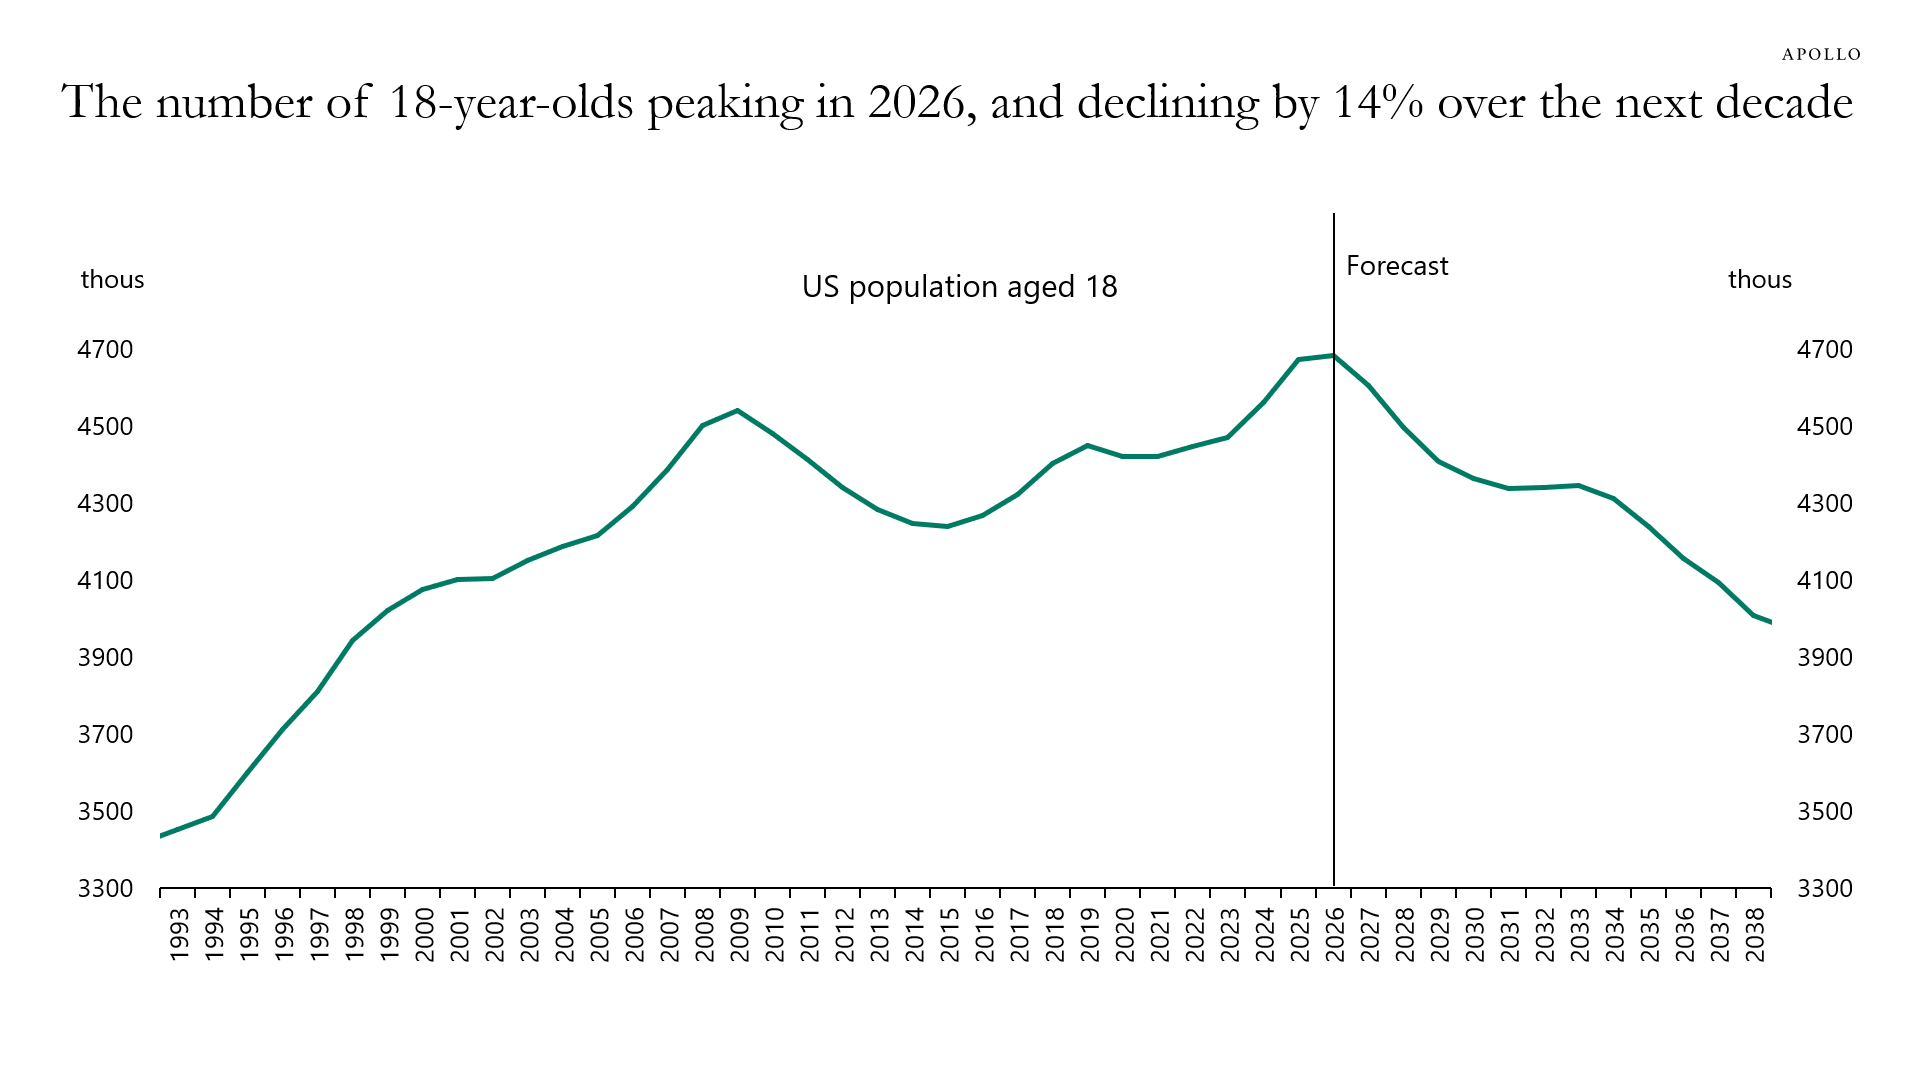
Sources: UN, Haver Analytics, Apollo Chief Economist
See important disclaimers at the bottom of the page.
Macroeconomic Indicators & Trends
Torsten
Slok
May 09, 2026
Top 10 Companies Account for 34% of Profits in the S&P 500
The share of S&P 500 profits captured by the 10 largest companies has doubled since 1996, see chart below. The S&P 500 is not a diversified index anymore, it is dominated by a small number of extraordinarily profitable tech companies.
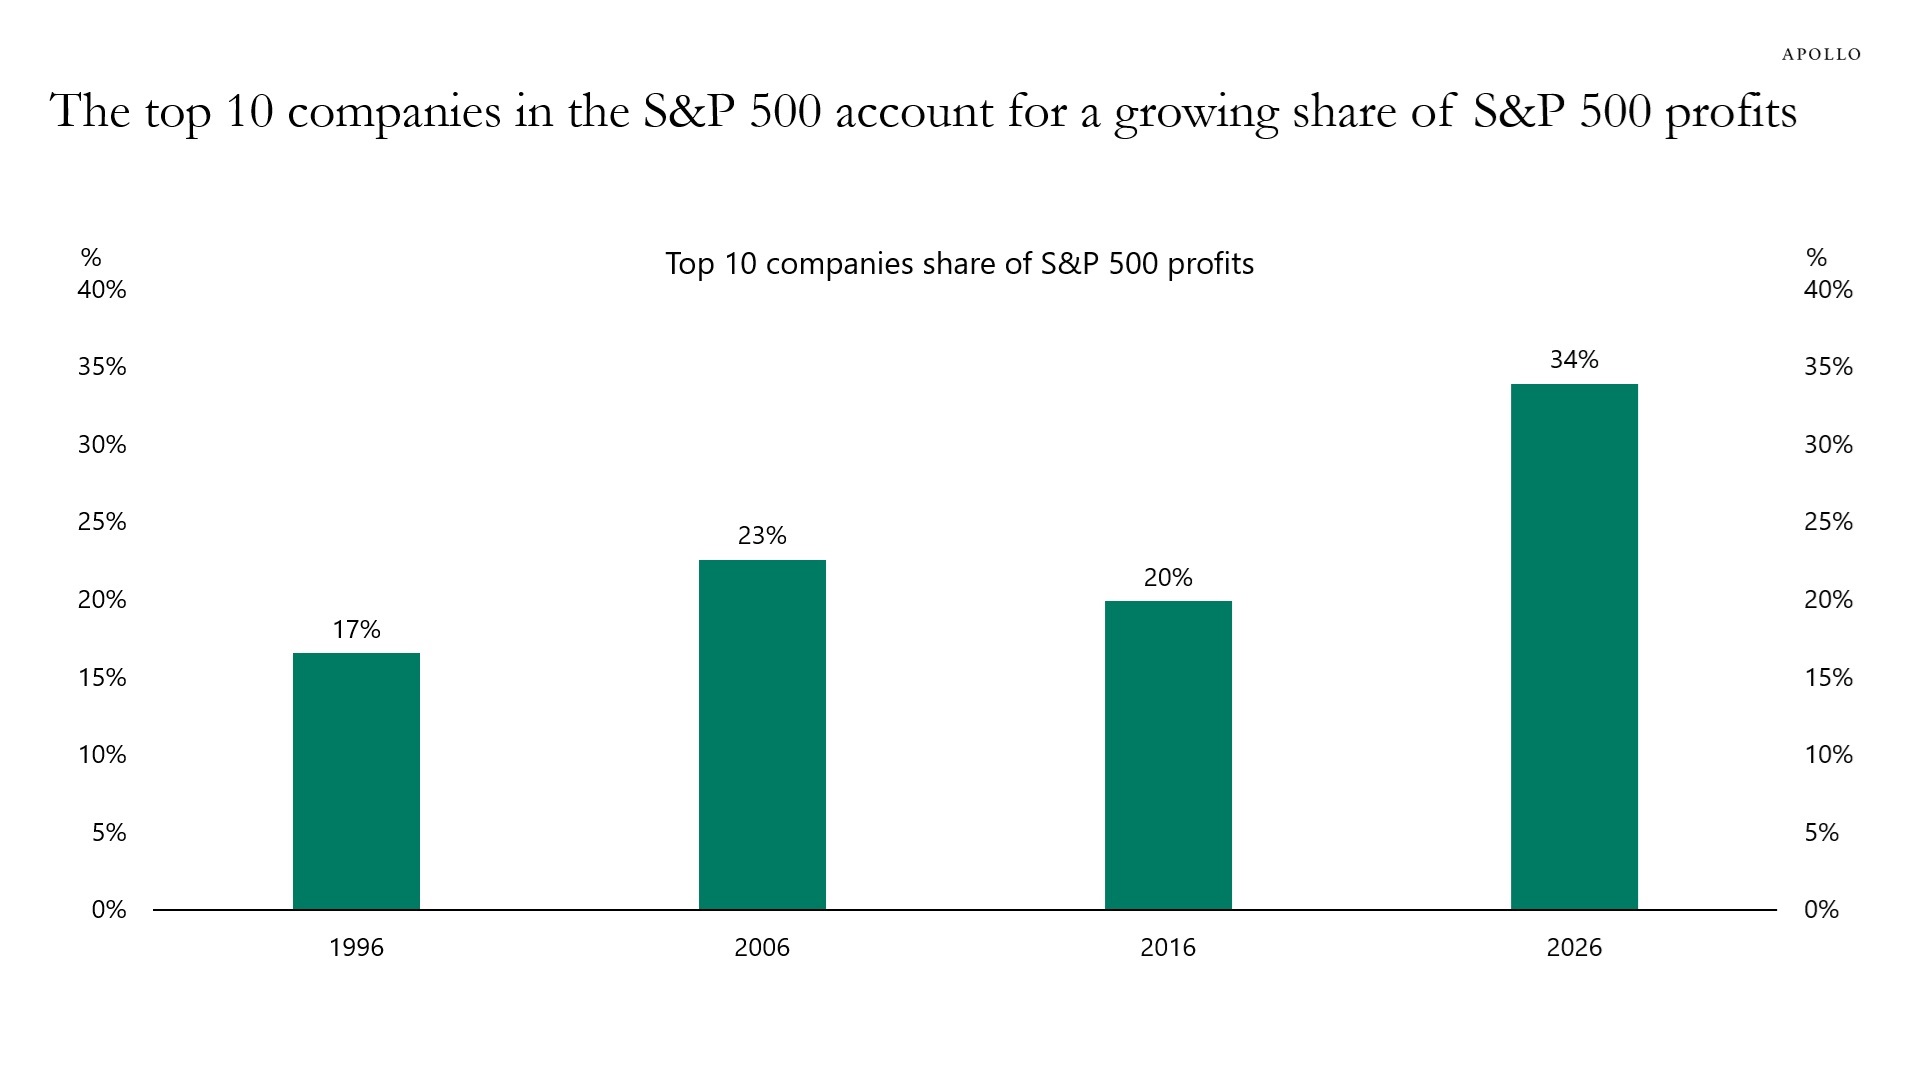
Sources: Bloomberg, Apollo Chief Economist
See important disclaimers at the bottom of the page.
Macroeconomic Indicators & Trends
Torsten
Slok
May 08, 2026
AI Is Fueling a New American Startup Boom
Business formation in the US is on the rise driven by AI, see here. As more Americans launch AI-driven ventures, early-stage deal activity is accelerating, with large rounds now capturing nearly 30% of all deal count versus almost nothing a decade ago, see chart below.
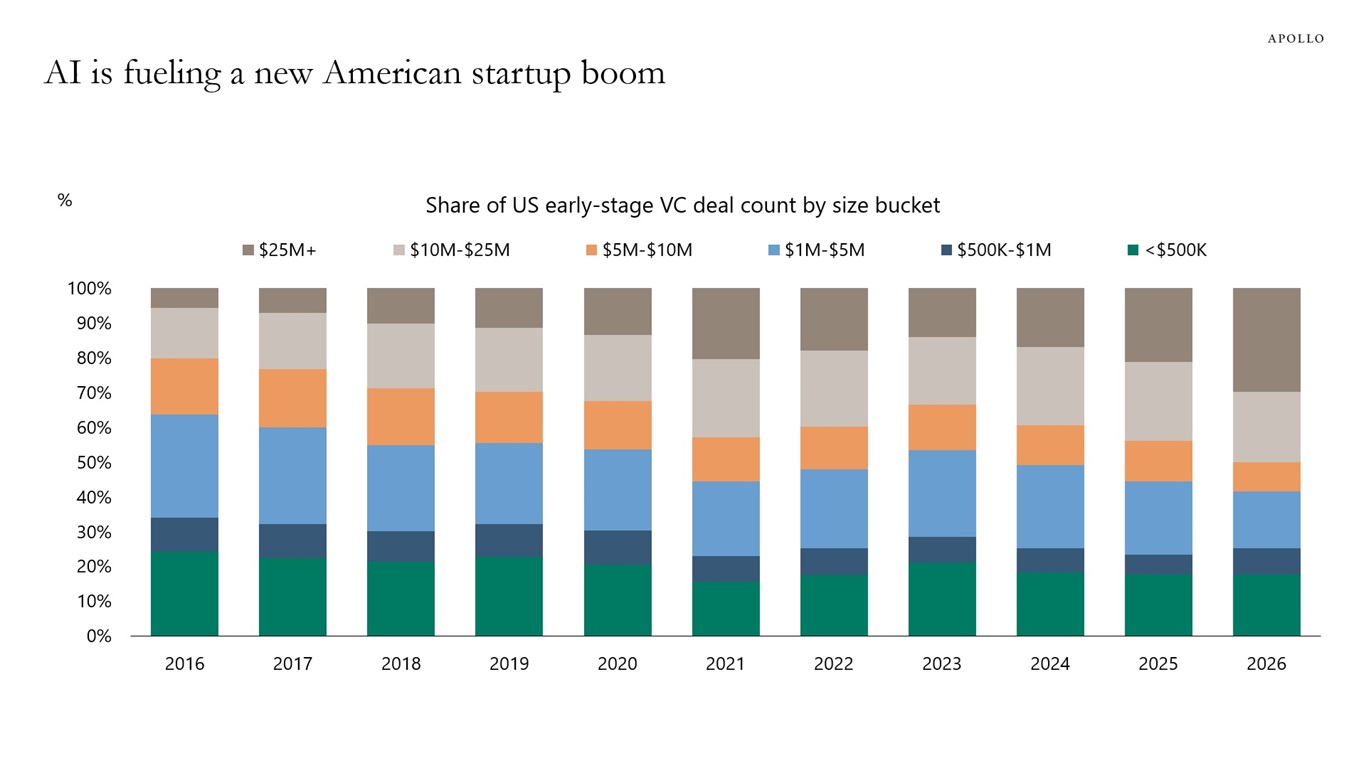
Sources: PitchBook, Apollo Chief Economist
See important disclaimers at the bottom of the page.