About the Author

avatar

Partner, Head of Apollo Thematic Investing

Did You Miss The Latest?
  • Convergence: Reimagining Multi-Asset Credit Allocations in a Converging Market
  • Risk & Rebalance: Four Dynamics Reshaping Portfolios
Share

About the Author

avatar

Partner, Head of Apollo Thematic Investing

Over the past year, investment in the infrastructure needed to support AI's growing ambitions has accelerated sharply.

Hyperscalers, chipmakers, and AI developers have committed unprecedented amounts of capital to expand computing capacity. Based on announced plans across the AI ecosystem, Apollo estimates that cumulative capital expenditures could reach ~$3.5 trillion through 2028.1


So far, the industry dynamics have been encouraging. Demand for compute capacity continues to exceed available supply, GPU rental prices are rising, and some infrastructure providers are reporting capital payback periods of less than a year.2 Yet the enormous scale of investment raises an important question: How much revenue will AI ultimately need to generate to justify all this spending?

Our analysis suggests the answer is approximately $1.5 trillion to $2 trillion in annualized AI revenue by the end of 2028, roughly 5-7 times today's level. By 2030, that figure could reach $3 trillion to $5 trillion, depending on how much additional infrastructure is deployed.3

The exact amount of AI revenue needed depends on how much AI compute actually gets deployed and the margins required within each layer of the AI ecosystem. Still, our analysis suggests that AI revenue will need to reach the trillions of dollars in the coming years, and reaching those levels will require AI to penetrate much larger markets and deliver measurable economic value across industries.

What Does It Take to Make the Math Work?

The economics behind AI infrastructure are relatively straightforward. Building and operating computing capacity is expensive, and every participant in the AI ecosystem eventually needs to generate sufficient revenue to cover those costs and earn an acceptable return.

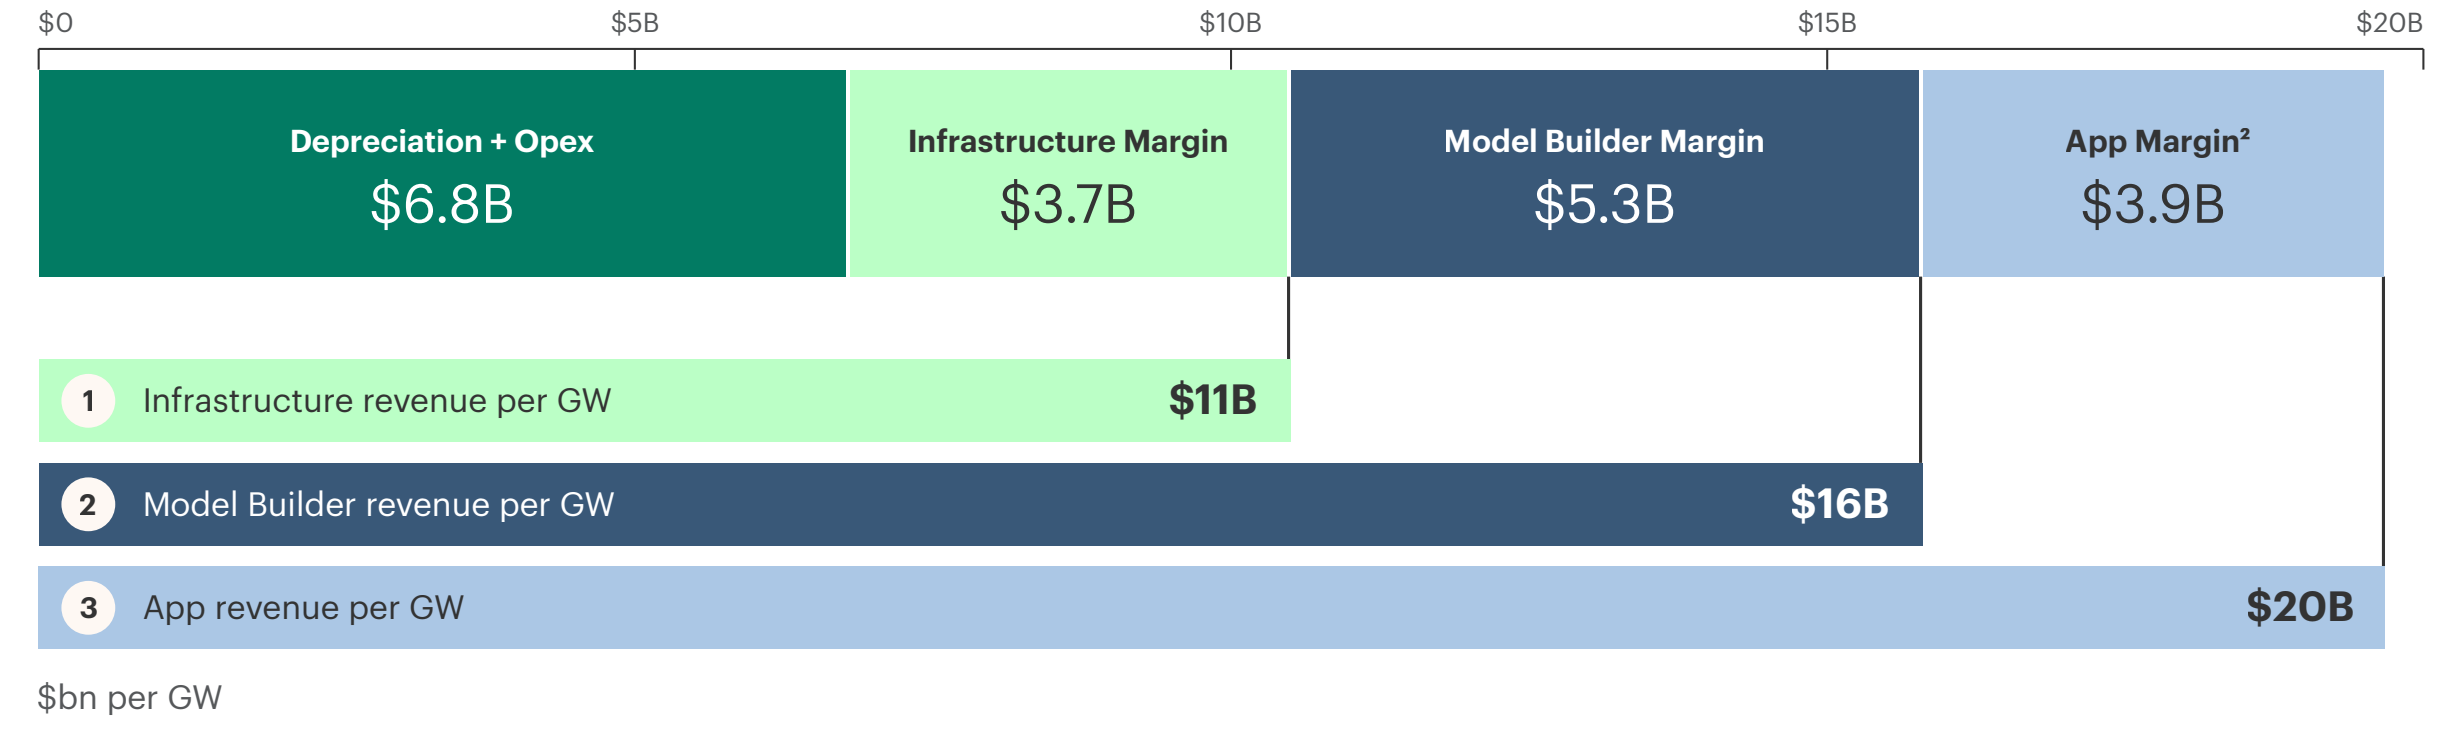
Consider a single gigawatt (GW) of AI computing capacity.4 Based on Apollo's estimates, the annual cost of operating that capacity, including depreciation and operating expenses, is approximately $7 billion.5 But the economics extend beyond the physical infrastructure. Hyperscalers providing compute capacity, companies developing foundation models, and businesses delivering AI-powered applications each need to earn a margin on their activities, at least in the long run.6

Assuming margins across these layers, we estimate each GW of deployed AI capacity ultimately requires approximately $20 billion in annual end-user revenue to support the economics of the ecosystem (Exhibit 1). With total deployed AI capacity potentially reaching roughly 100 GW by the end of 2028,the revenue required to support the buildout could reach approximately $1.5 trillion to $2 trillion annually.7

Exhibit 1: The $20 Billion-per-GW Revenue Equation (Illustrative) 1 

Stacked bar chart of AI compute economics per gigawatt: $6.8B depreciation and opex plus infrastructure, model builder, and app margins, with cumulative revenue rising from $11B to $16B to $20B.

Source: Apollo Analysts. For illustrative purposes only. (1) We assume $30bn IT capex per GW and 6yr useful life, which roughly maps to Blackwell generation chips. Vera Rubin chips annual depreciation/opex would be higher, closer to $9bn per GW annually, raising the associated revenue requirement per GW. (2) App-layer 50% gross margin applies to the ~25% of the app layer served by standalone app companies; the remainder is delivered directly by hyperscalers/model builders.

Ultimately, this revenue is anticipated to largely come from end users at the application layer: businesses and consumers paying for AI-powered products and services, including consumer subscriptions and enterprise AI applications. Today, end-user AI revenue is already growing at an extraordinary pace. Annualized AI application revenue reached approximately $200 billion in the second quarter of 2026, up from just $11 billion in early 2024.By September, that figure had climbed to approximately $276 billion, representing roughly 3.75-fold annual growth since 2023.8

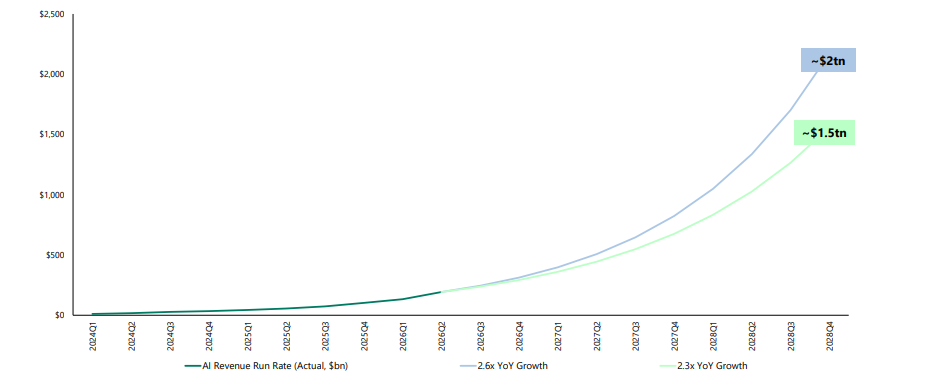
That growth is impressive by almost any historical standard. Yet it also underscores how much further the industry needs to go. To reach our estimated $1.5 trillion to $2 trillion revenue requirement by the end of 2028, AI revenue would need to grow approximately 2.3 to 2.6 times annually over the next two years (Exhibit 2). Recent growth rates suggest that trajectory is achievable, although maintaining rapid growth becomes increasingly difficult as the revenue base expands.

Exhibit 2: The Path to $1.5-$2 Trillion (Illustrative) 

Line chart of AI revenue run rate in billions of dollars, rising slowly in actuals and then curving sharply upward in two projections, reaching about $2 trillion at 2.6x year-over-year growth and about $1.5 trillion at 2.3x.

Source: Exponential View, Apollo Analysts as of September 2026.

Of course, this calculus assumes that projected infrastructure spending materializes on schedule. Power constraints, chip shortages, construction delays, and restrictive policies in the aftermath of the midterms could slow deployment. Importantly, capital markets can provide another natural check on overinvestment. If AI revenues disappoint, lower valuations and higher financing costs could slow the pace of infrastructure spending, potentially reducing the revenue ultimately needed to justify the buildout. This feedback mechanism could help prevent excess capacity and mitigate the risk of an AI investment bubble. Anthropic’s S-19 highlights a related risk, warning that slower revenue growth could constrain investment in compute and model development, weakening its competitive position and putting further pressure on future growth. If these pressures persist, they could weigh on capital spending plans for the second half of 2027 and 2028.

Companies also retain some flexibility to stage investment as demand develops. Anthropic, for example, describes securing data center capacity early while “deferring larger accelerator investments until our specific compute needs are more certain.” A slower buildout would, all else equal, lower the near-term revenue requirement, although contractual obligations on capacity already committed would remain. Finally, our model stacks a margin at each of the three layers, so greater vertical integration or more ecosystem subsidies would lower the revenue needed to justify the buildout. 

Where the Opportunity Lies

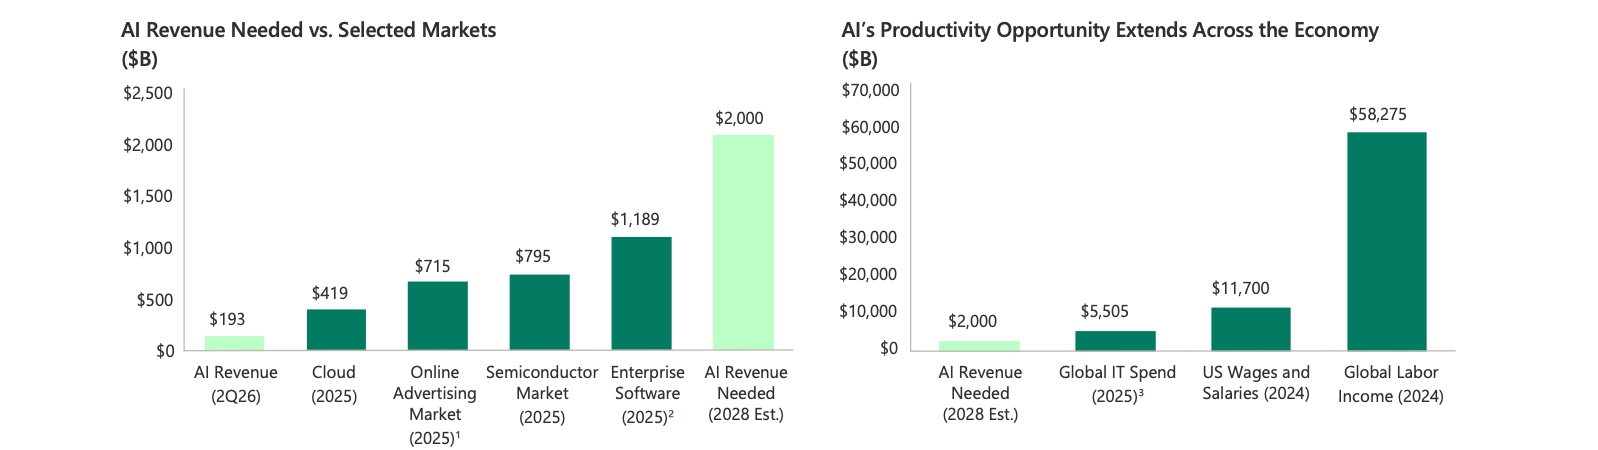
The scale of the opportunity becomes clearer when viewed against the markets AI could potentially address. The global cloud computing market generated approximately $419 billion in revenue in 2025, while the online advertising and semiconductor markets were approximately $715 billion and $795 billion10, respectively. Even the global enterprise software market, estimated at nearly $1.2 trillion,11 is smaller than the $1.5-$2 trillion in annual AI revenue our model suggests could be needed by the end of 2028 (Exhibit 3).

AI’s potential, however, extends well beyond traditional technology spending. Its economic value likely lies in helping people work more productively and enabling businesses to expand what they can deliver. With global labor income estimated at approximately $58 trillion annually,12 even modest productivity improvements could generate substantial additional economic value.

Exhibit 3: Putting AI’s Revenue Ambitions in Perspective 

Two bar charts comparing the $2 trillion AI revenue needed by 2028 to today’s $193B, and to larger markets including cloud, advertising, semiconductors, enterprise software, global IT spend, US wages, and global labor income.

Source: Data compiled by Apollo Analysts. AI revenue per Exponential View, Apollo Analysts. Cloud estimates per Synergy Research Group, February 2026. Semiconductor estimates per World Semiconductor Trade Statistics, March 2026. (1) Online advertising per Magna Global, June 2025. (2) Enterprise software per Bank of America, April 2024. (3) Global IT spend per Bank of America, April 2024. US wages and salaries per BLS as of 2024. Global labor income share per World Bank, International Labour Organization, September 2024. Latest available data as of October 2026.

AI could also make new products and services economically viable, expanding demand and creating new categories of work over time. For AI providers, earning a share of the incremental value their technology helps create could support a path toward the annual revenue our model suggests may be needed. 

Beyond labor productivity, several other sources of demand could help support AI's revenue ambitions. Enterprise IT budgets offer significant room for growth: According to a May 2026 McKinsey client survey,13 the median enterprise allocates approximately 7% of its IT budget to AI, compared with roughly 23% among AI-native organizations. Consumer spending presents another opportunity, as AI-powered applications compete for a share of the hundreds of billions of dollars spent annually on digital advertising and subscriptions. AI could also expand existing markets, including pharmaceuticals, cybersecurity, and defense technology, by enabling new products and services. No single market is likely to generate trillions of dollars in AI revenue on its own, but together they represent a substantial opportunity for growth.

The math is demanding. But AI has something few other technology cycles have had: the potential to capture spending from markets that extend far beyond technology itself.

In our view, the question is not whether AI can translate those opportunities into sustainable revenue at scale. We believe AI revenue will likely continue to increase rapidly over the next few years as it penetrates more use cases and models continue to improve.

The question instead is whether AI revenue can increase quickly enough to support the infrastructure buildout. The nature of the buildout could help mitigate the downside risk: Capacity is built in stages, and the majority of the cost sits in accelerators and IT equipment that can be deferred, allowing spending to adjust if necessary.

The industry has demonstrated its ability to attract capital and build infrastructure. The next phase will be the translation of that investment into a broadening revenue base.

Download the Article


End Notes:

1. Apollo Analysts, Bloomberg. Data as of August 2026. Based on announced AI infrastructure investment plans across hyperscalers, chipmakers, model developers, and neocloud providers. Capex covers the 2026-2028 period.

2. The Growing Compute Shortage, June 2026. RBC Capital Markets, “Semiconductors: GPU Rental Pricing Trends – October 2026,” November 2026.

3. Apollo Analysts. Estimates as of September 2026, based on projected AI computing capacity, infrastructure costs, and assumed margins across the AI ecosystem.

4.Blackwell generation AI chips.

5. Apollo Analysts. Estimates as of September 2026. Assumes $30 billion in IT capex per GW and $15 billion in data center capex per GW, plus operating expenses.

6. This is a simplified framework. A single company may operate across all three layers of the AI stack. For example, Meta and Google own infrastructure and develop their own models and applications.

7. Apollo Analysts. Estimates as of September 2026. Based on conservative and optimistic scenarios for AI computing capacity deployment through 2028. Revenue for the infrastructure layer only would be roughly half these figures.

8. Exponential View, Apollo Analysts. Data as of September 2026. AI application revenue estimates exclude AI-driven advertising revenue uplift at Google and Meta, as well as chip sales.

9. Anthropic, PBC, Form S-1 Registration Statement (filed October 26, 2026), Management's Discussion and Analysis of Financial Condition and Results of Operations (MD&A), p. 141.

10. Data as of June 2025.

11. Data as of April 2024.

12. Data as of September 2024.

13. McKinsey client survey, May 2026.

Did You Miss The Latest?
  • Convergence: Reimagining Multi-Asset Credit Allocations in a Converging Market
  • Risk & Rebalance: Four Dynamics Reshaping Portfolios
Share
Download PDF

Related Insights

IMPORTANT DISCLOSURE INFORMATION All information contained in this material is as of October 2026 unless otherwise indicated. This material is for informational purposes only and should not be treated as research. This material may not be distributed, transmitted or otherwise communicated to others, in whole or in part, without the express written consent of Apollo Global Management, Inc. (together with its subsidiaries, “Apollo”). The views and opinions expressed in this material are the views and opinions of Apollo Analysts. They do not necessarily reflect the views and opinions of Apollo and are subject to change at any time without notice. Further, Apollo and its affiliates may have positions (long or short) or engage in securities transactions that are not consistent with the information and views expressed in this material. There can be no assurance that an investment strategy will be successful. Historic market trends are not reliable indicators of actual future market behavior or future performance of any particular investment which may differ materially and should not be relied upon as such. This material does not constitute an offer of any service or product of Apollo. It is not an invitation by or on behalf of Apollo to any person to buy or sell any security or to adopt any investment strategy, and shall not form the basis of, nor may it accompany nor form part of, any right or contract to buy or sell any security or to adopt any investment strategy. Nothing herein should be taken as investment advice or a recommendation to enter into any transaction. There can be no assurance that any trends discussed herein will continue. Unless otherwise noted, information included herein is presented as of the dates indicated. This material is not complete and the information contained herein may change at any time without notice. Apollo does not have any responsibility to update the material to account for such changes. Apollo has not made any representation or warranty, expressed or implied, with respect to fairness, correctness, accuracy, reasonableness, or completeness of any of the information contained herein, and expressly disclaims any responsibility or liability, thereof. The information contained herein is not intended to provide, and should not be relied upon for, accounting, legal or tax advice or investment recommendations. Investors should make an independent investigation of the information contained herein, including consulting their tax, legal, accounting or other advisors about such information. Apollo does not act for you and is not responsible for providing you with the protections afforded to its clients. Certain information contained herein may be “forward-looking” in nature. Due to various risks and uncertainties, actual events or results may differ materially from those reflected or contemplated in such forward-looking information. As such, undue reliance should not be placed on such information. Forward-looking statements may be identified by the use of terminology including, but not limited to, “may”, “will”, “should”, “expect”, “anticipate”, “target”, “project”, “estimate”, “intend”, “continue” or “believe” or the negatives thereof or other variations thereon or comparable terminology. Investing involves risk including loss of principal. Alternative investments often are speculative, typically have higher fees than traditional investments, often include a high degree of risk and are appropriate only for eligible long-term investors who are willing to forgo liquidity and put capital at risk for an indefinite period of time. They may be highly illiquid and can engage in leverage and other speculative practices that may increase volatility and risk of loss. This material may reference trade names, trademarks, or service marks of companies that are not owned by Apollo or Apollo funds, or that may be held as investments by Apollo or one or more Apollo funds. The use or display of these companies’ trade names, trademarks, or service marks is not intended to imply any relationship with, or endorsement or sponsorship of Apollo, by such companies. All company names and logos are trademarks of their respective holders. Past performance is not necessarily indicative of future results. Additional information may be available upon request.