Marc Rowan on how Apollo’s differentiated strategy was built for this moment.
Germany is hosting its Invest in Germany Summit this week, against the backdrop of rising investment needs in AI, infrastructure, defense and energy resilience.
Meeting these longer-term investment needs will require public and private capital across both credit and equity markets. And Germany starts with a relatively small pool of domestic institutional capital.
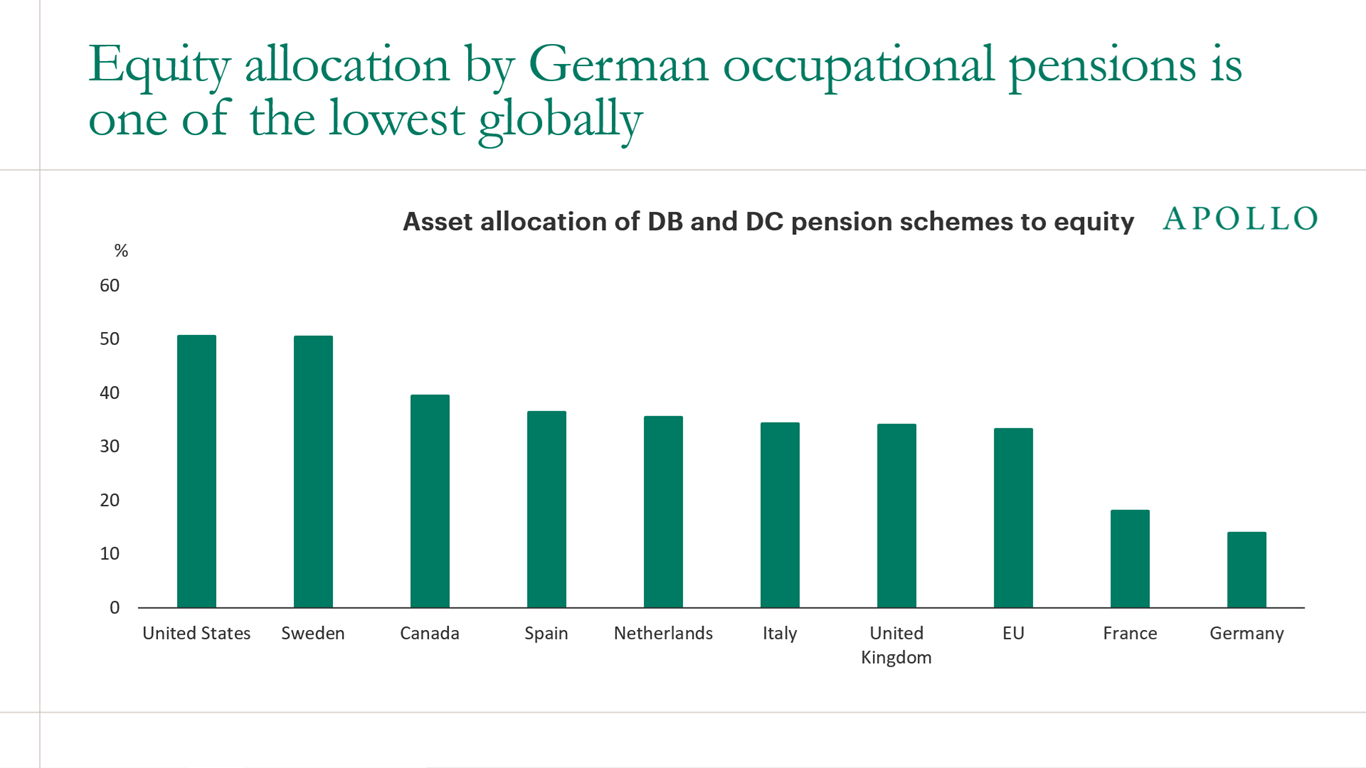
Germany has the least-funded pension system of any major advanced economy. Funded pension assets are only around 7% of GDP against 149% in Sweden and 185% in Canada. Furthermore, German occupational pension schemes allocate just 14% to equities, compared with 34% across the EU and around 50% in the US, see chart below.
Yet Germany has the highest household savings rate in Europe, with much of household wealth held in deposits.
This is why pension reform matters beyond retirement policy. The reforms now under way could ultimately generate around €90 billion of new annual funded pension flows, equivalent to roughly 2% of GDP.
The bottom line is that Germany is trying to increase investment at the same time as it builds a much larger domestic pool of long-term savings. Pension reform could help connect the two.
We look at the numbers, the reforms and the implications for capital markets in our new presentation on German pension reform, available here.
Written by Huw van Steenis
Sources: European Commission (2025), Staff Working Document, Table 35 (EU); Federal Reserve, Financial Accounts Z.1, Table S.129.s (US); Pensions Policy Institute (2025), Pension Scheme Assets, Figure 2 (UK); and Statistics Canada (2025), Trusteed Pension Funds, Q4 2024 (Canada); caveat: figures are not fully comparable, as the EU covers occupational pension institutions, the US includes public and private pensions and non-equity mutual funds, the UK includes broader retirement assets but excludes private equity, and Canada includes public and private occupational pensions with equity exposure estimated from reported data, Apollo European and Policy Strategist.
See important disclaimers at the bottom of the page.
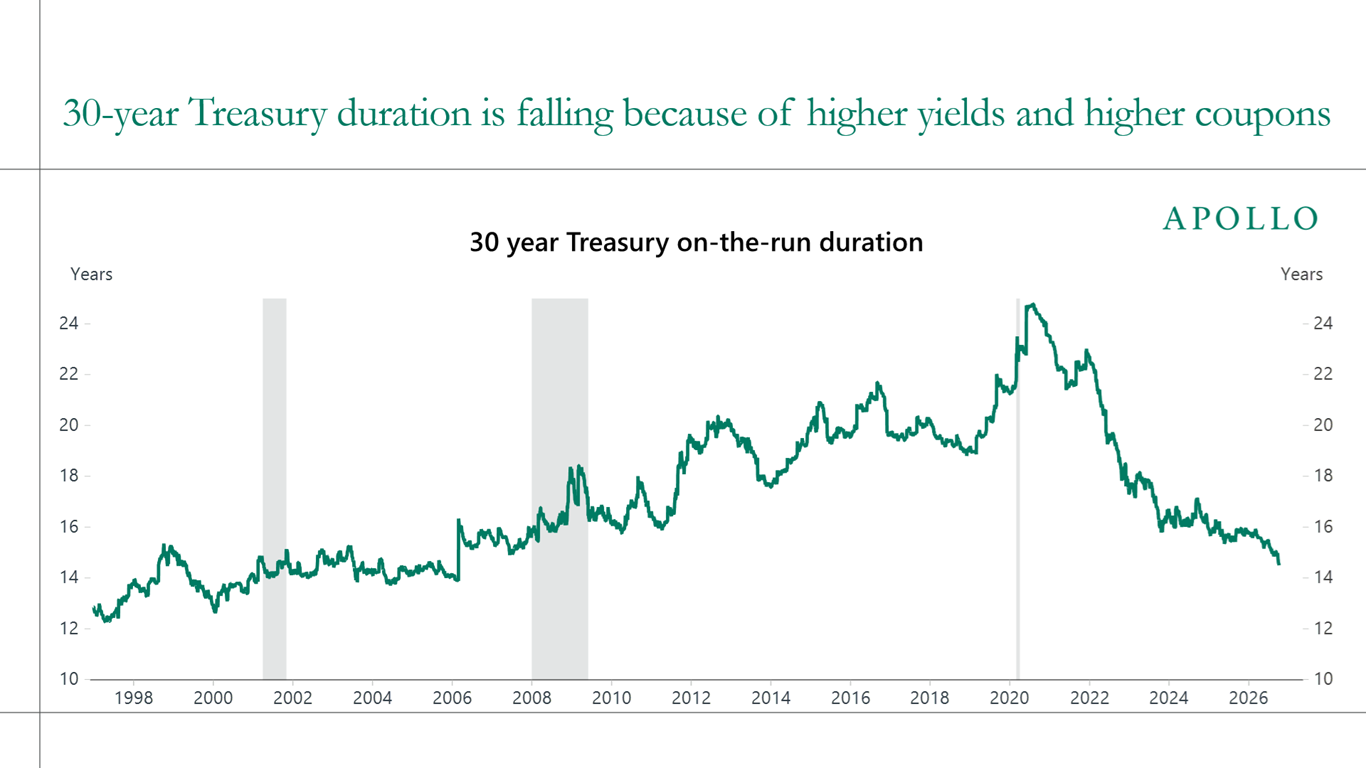
Duration measures how sensitive a bond’s price is to changes in interest rates, and for the 30-year Treasury, it has fallen from 25 years in 2020 to 14 today because of higher yields and higher coupons.
That means long Treasuries offer less cushion per dollar in a downturn.
As a result, investors may need to own more fixed income to hedge against the risk of a slowdown. Pairing Treasuries with high-quality credit can help.
Investment-grade private placements and infrastructure debt are often long-dated and fixed-rate, so they can carry meaningful duration, while asset-backed finance can add income, with duration varying by structure.
The bottom line is that when interest rates stay higher for longer, lower duration weakens the hedge that long Treasuries provide.
Sources: ICE BofAML, Macrobond, Apollo Chief Economist
See important disclaimers at the bottom of the page.
October 16, 2026
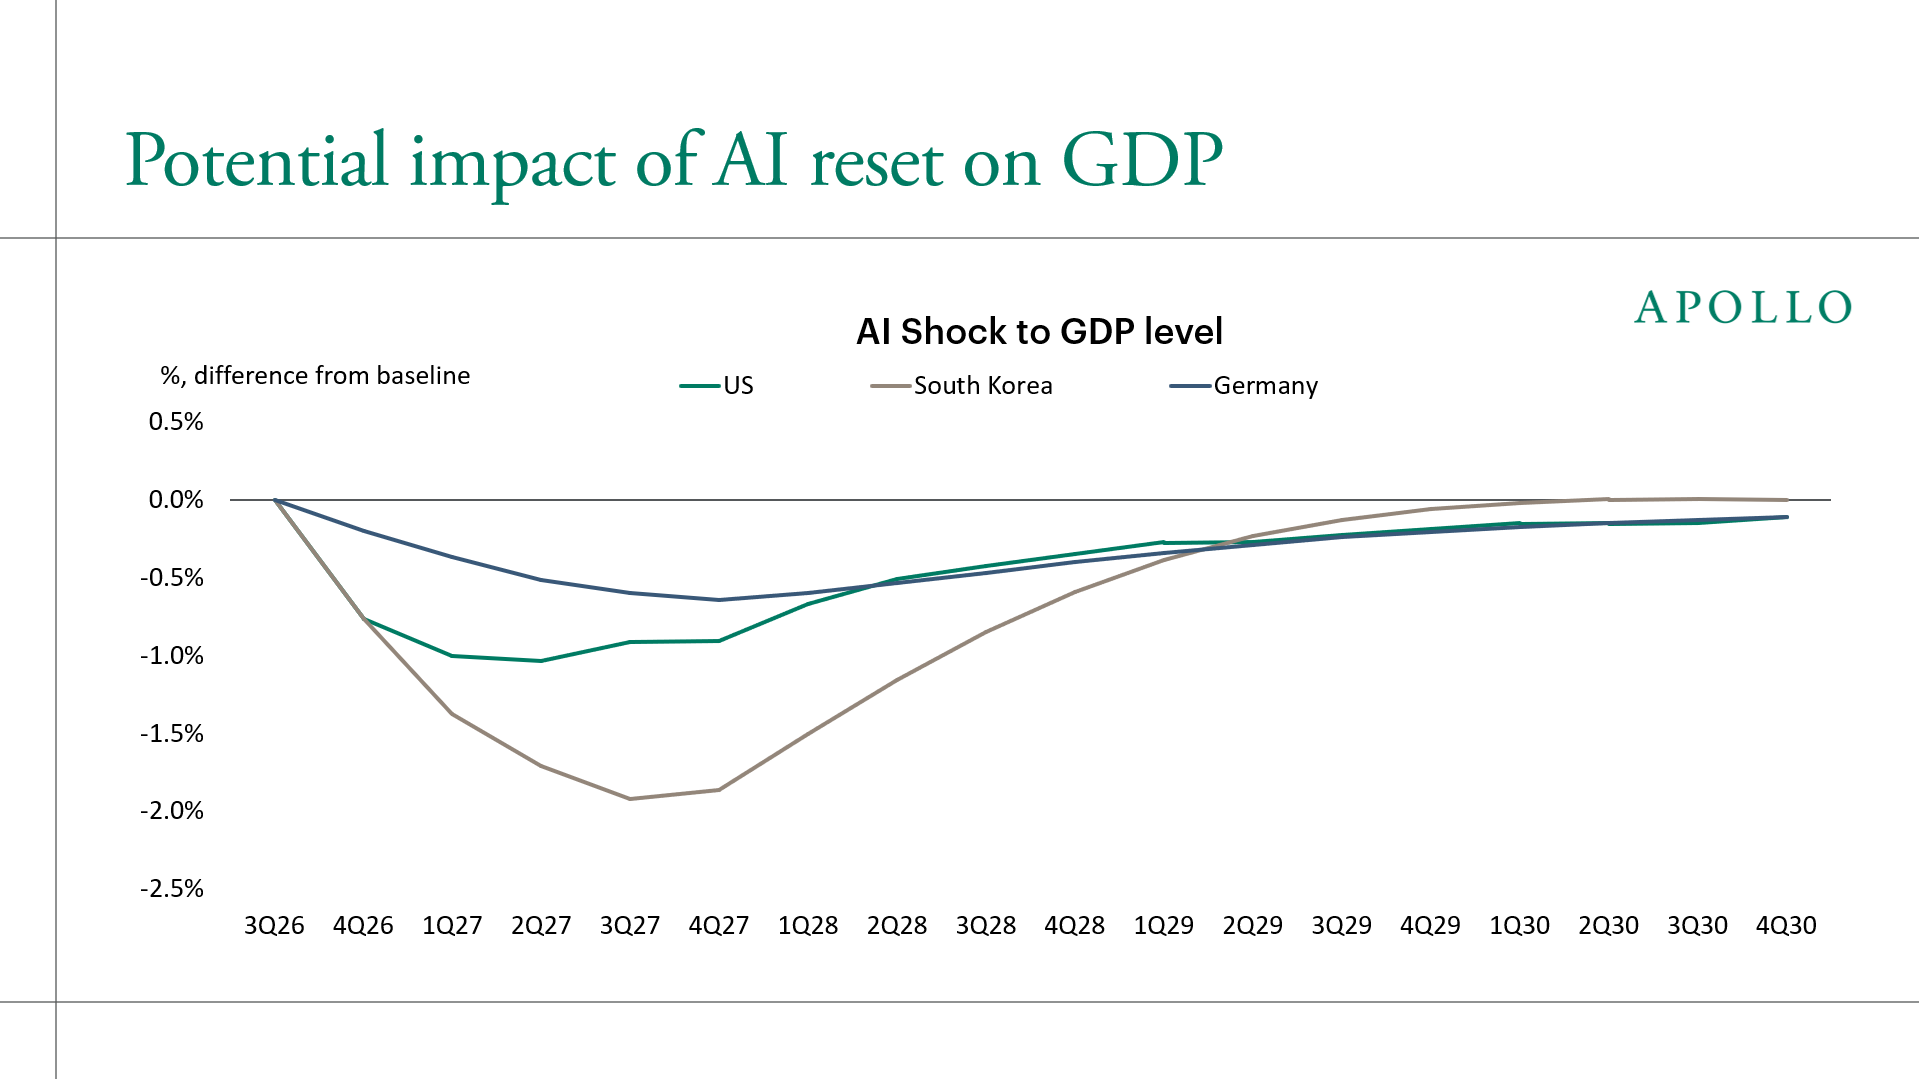
Let’s call the ongoing correction in AI assets "The AI Reset," where investors mark down their expectations for future cash flows.
What are the implications for the economy?
A sharp reset in AI expectations could undermine corporate confidence, trigger a pullback in capex and weigh on GDP growth, just as higher oil prices, tariffs and tighter immigration restrictions push inflation higher, raising the risk of a stagflationary environment in which growth slows even as price pressures persist.
Note: Bloomberg SHOK model scenario assumes a widening in global credit spreads of 10–30 bps, a 1–4% decline in US investment and a 1–3% decline in South Korean exports, with shocks phased in from 4Q26 and tapering through 4Q27. GDP impacts are shown as percentage deviations from baseline forecasts. Sources: Bloomberg SHOK, Apollo Chief Economist
See important disclaimers at the bottom of the page.
October 15, 2026
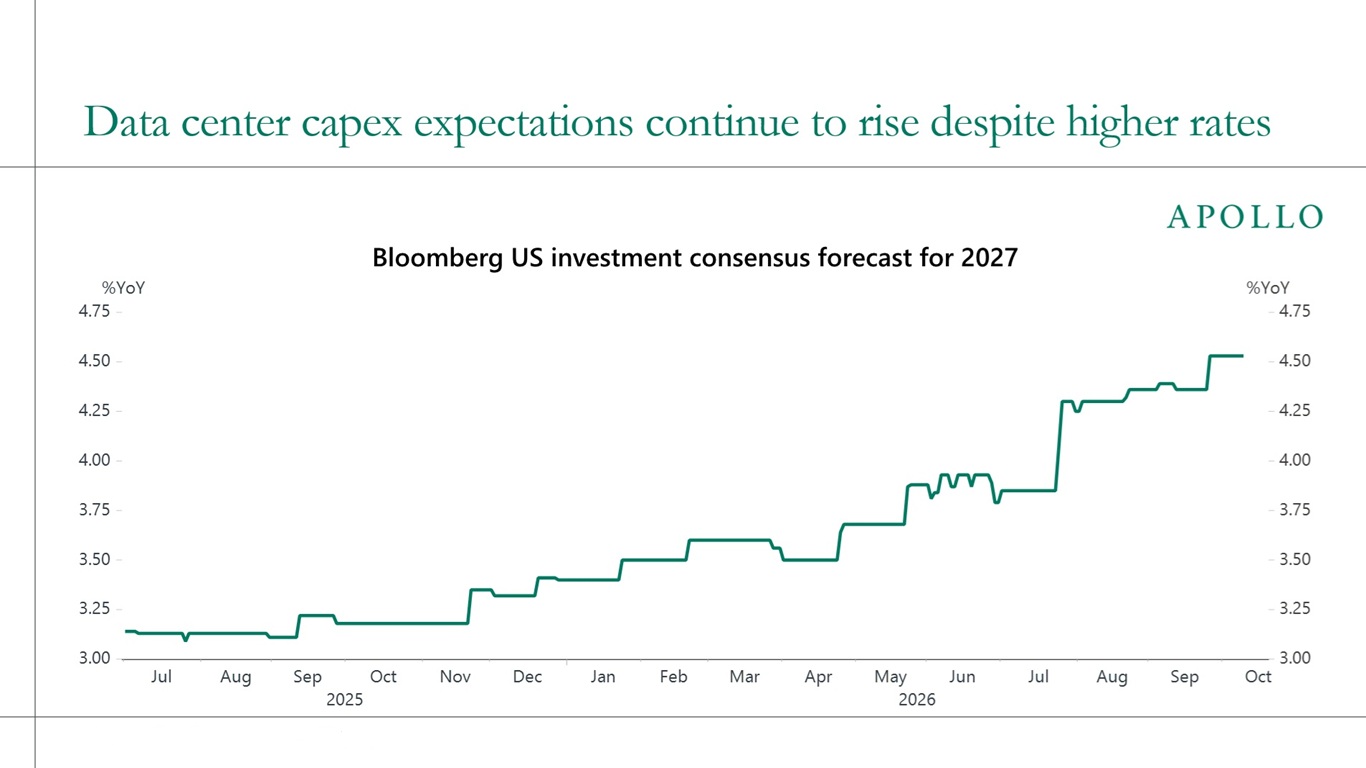
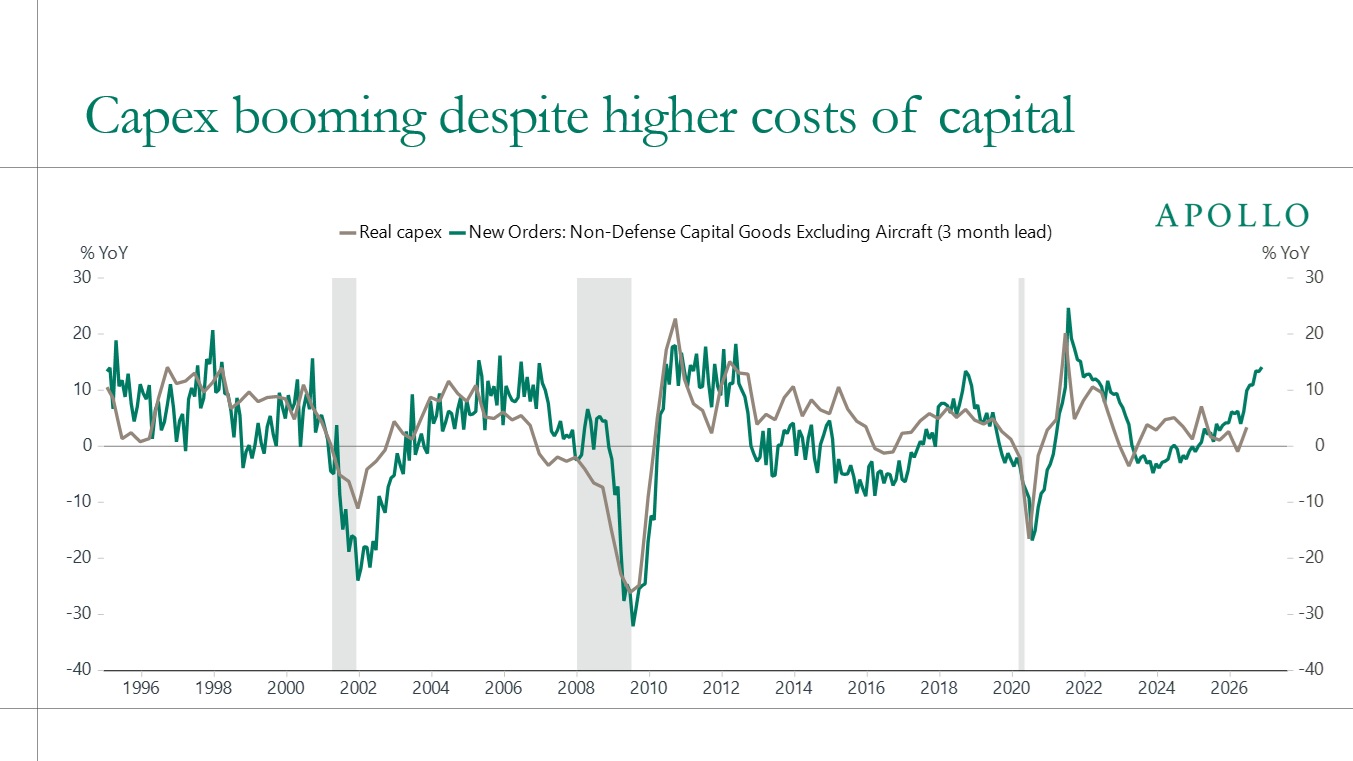
Higher interest rates have not slowed the data center buildout. Over the past year, 10-year yields are up 125 bps, yet consensus forecasts for 2027 capex growth have only been revised higher, see chart below.
The reason is that many AI investors expect AI investments to return more than 10%, well above the 4% Fed funds rate. With borrowing costs far below expected returns, the AI spending boom is not sensitive to interest rates, and tighter policy is losing its bite on the economy.
The implication for investors is that upward pressure on rates persists until either the Fed raises rates above expected AI returns, or expected AI returns fall below the Fed funds rate. With the consensus still very bullish on AI, see chart again, investors should expect continued upward pressure on rates.
A Middle East deal after the midterm elections could push yields lower via lower oil prices. But the fundamental direction of travel for rates remains higher, especially with ongoing fiscal challenges and heavy Treasury issuance adding to the term premium.
The bottom line for both public and private markets is that higher for longer continues.
Sources: Bloomberg, Macrobond, Apollo Chief Economist
See important disclaimers at the bottom of the page.
A new survey by Mavvrik and Benchmarkit of 396 enterprises finds that companies are adopting AI faster than they are building the financial controls to keep its costs in check.
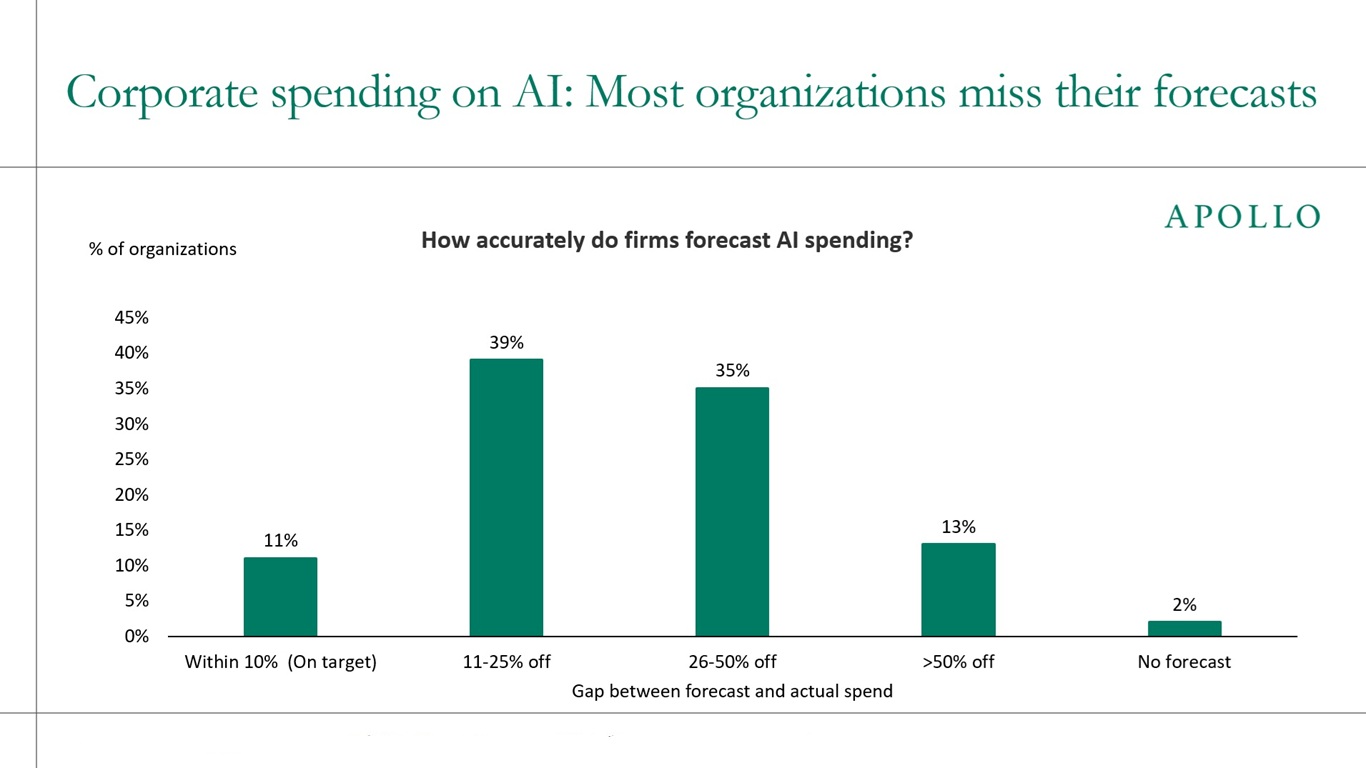
Only 11% of firms forecast their AI spending within 10% of actual, down from 15% last year, see chart below.
The survey also shows that those misses are changing decisions, with 62% of firms saying an unexpected AI cost altered a business decision and one in four delaying or canceling an AI initiative.
The impact is showing up in profitability too, with 81% of companies reporting moderate-to-high gross margin impact from AI costs, including 63% who see a 6 to 15 percentage point decrease.
The bottom line is that we are still waiting for the ROI from AI investments, and this survey shows that while we wait, costs continue to surprise and become harder to predict and control.
Sources: Mavvrik and Benchmarkit, 2026 State of AI Cost Governance Report (n = 396, April-May 2026), Apollo Chief Economist
See important disclaimers at the bottom of the page.
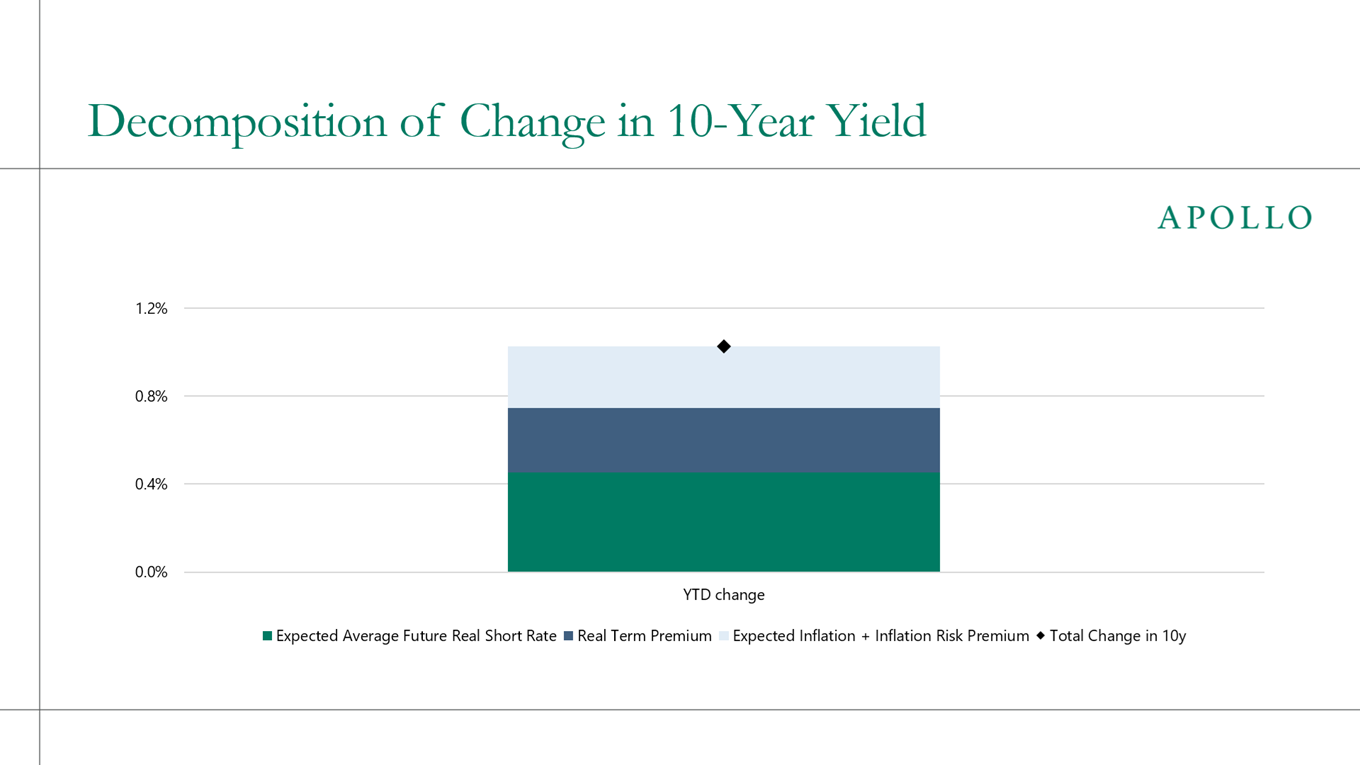
US 10-year Treasury yields have risen by about 100 bps since the beginning of the year. A model developed by Fed economists D’Amico, Kim and Wei decomposes Treasury yields to show what is driving the move. Updated estimates released point to two main factors:
1. The expected path of real short rates has moved higher. The model estimates that the average real short rate expected over the next 10 years has increased. Lower oil prices or weaker growth could ease some of this pressure and help bring longer-term rates down.
2. The term premium has risen. The term premium is the additional yield investors demand to hold a long-dated bond beyond what the expected path of Fed policy would imply. It can therefore capture compensation for longer-term risks, including concerns around fiscal sustainability or Fed credibility.
The bottom line is that higher long rates this year reflect both the higher expected policy path from the Fed and investors asking for more compensation to hold duration.
Written by Allison Boxer
Data as of 9/30/2026. Sources: D'Amico, S., D. H. Kim, and M. Wei (2018), "Tips from TIPS: The Informational Content of Treasury Inflation-Protected Security Prices," Journal of Financial and Quantitative Analysis, 53(1), 395-436. Kim, Don, Cait Walsh, and Min Wei (2019). "Tips from TIPS: Update and Discussions," FEDS Notes. Washington: Board of Governors of the Federal Reserve System, May 21, 2019, https://doi.org/10.17016/2380-7172.2355
See important disclaimers at the bottom of the page.
October 12, 2026
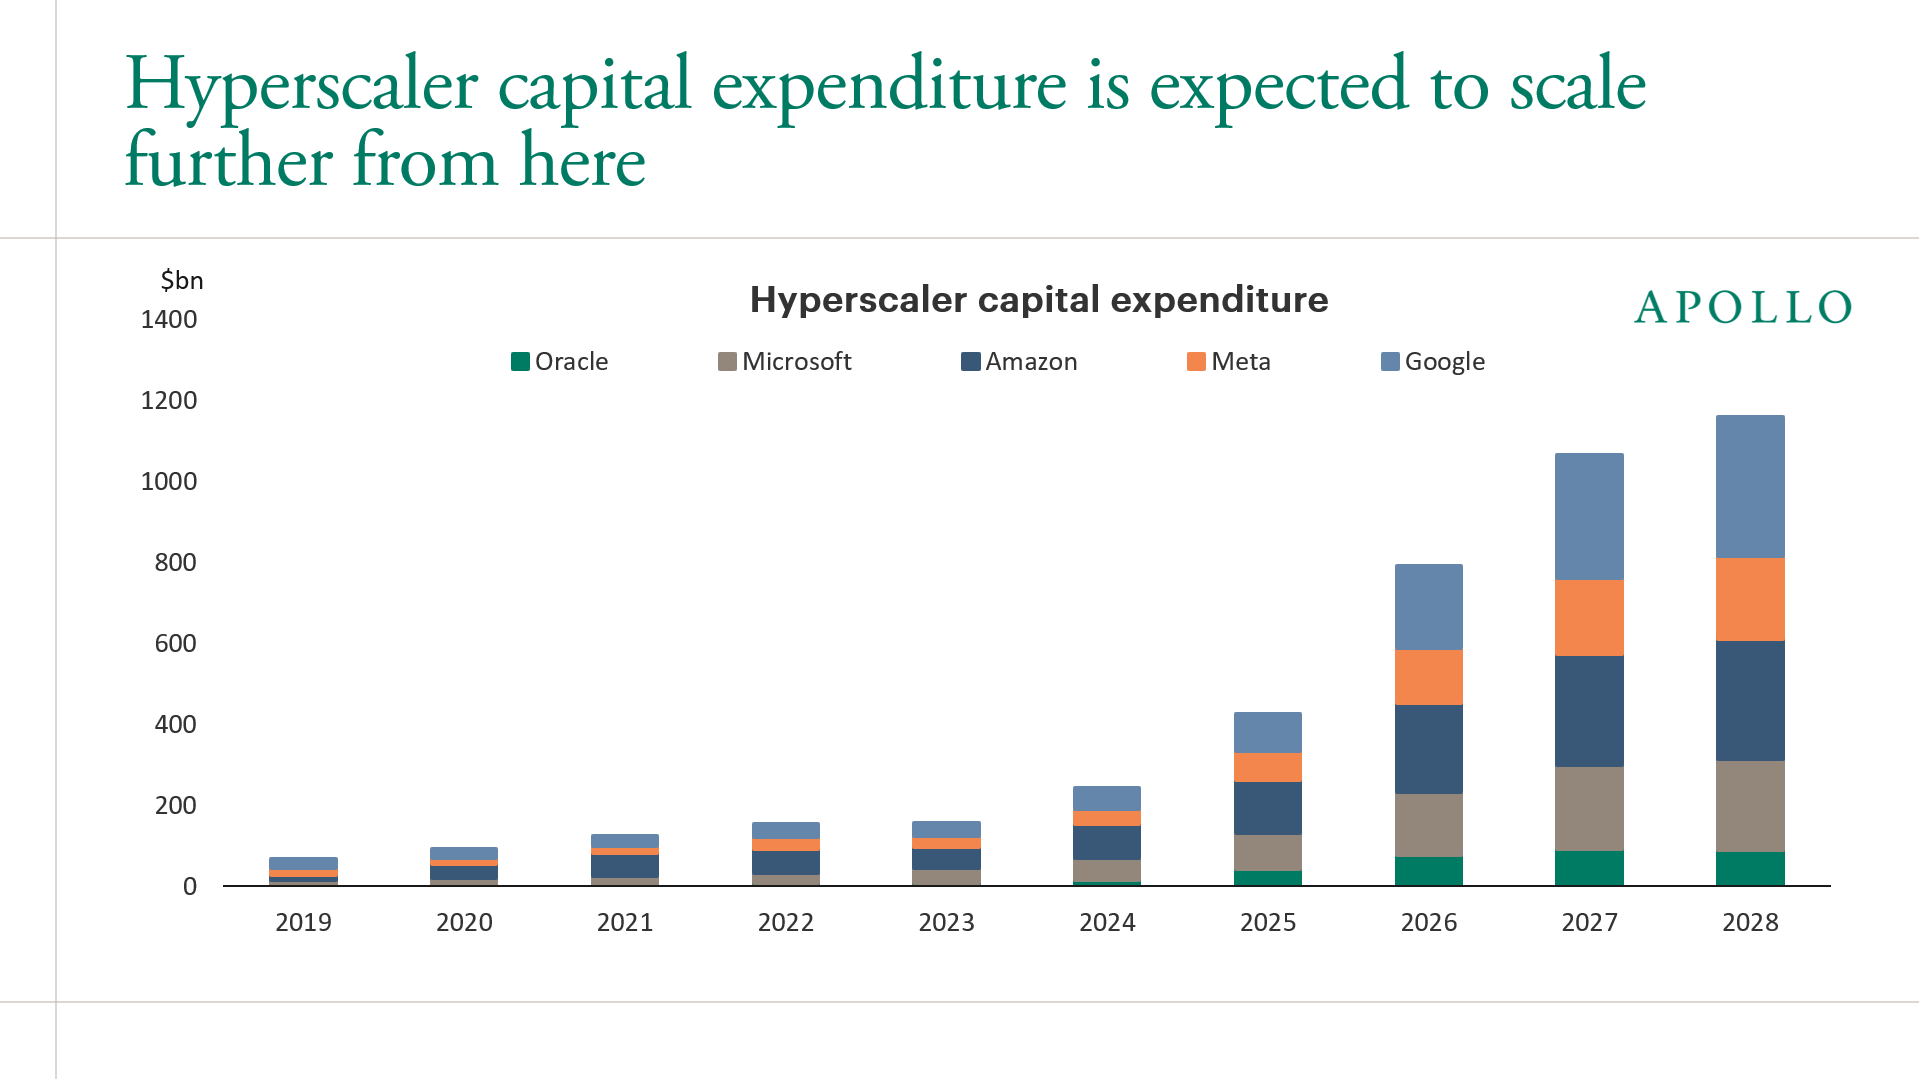
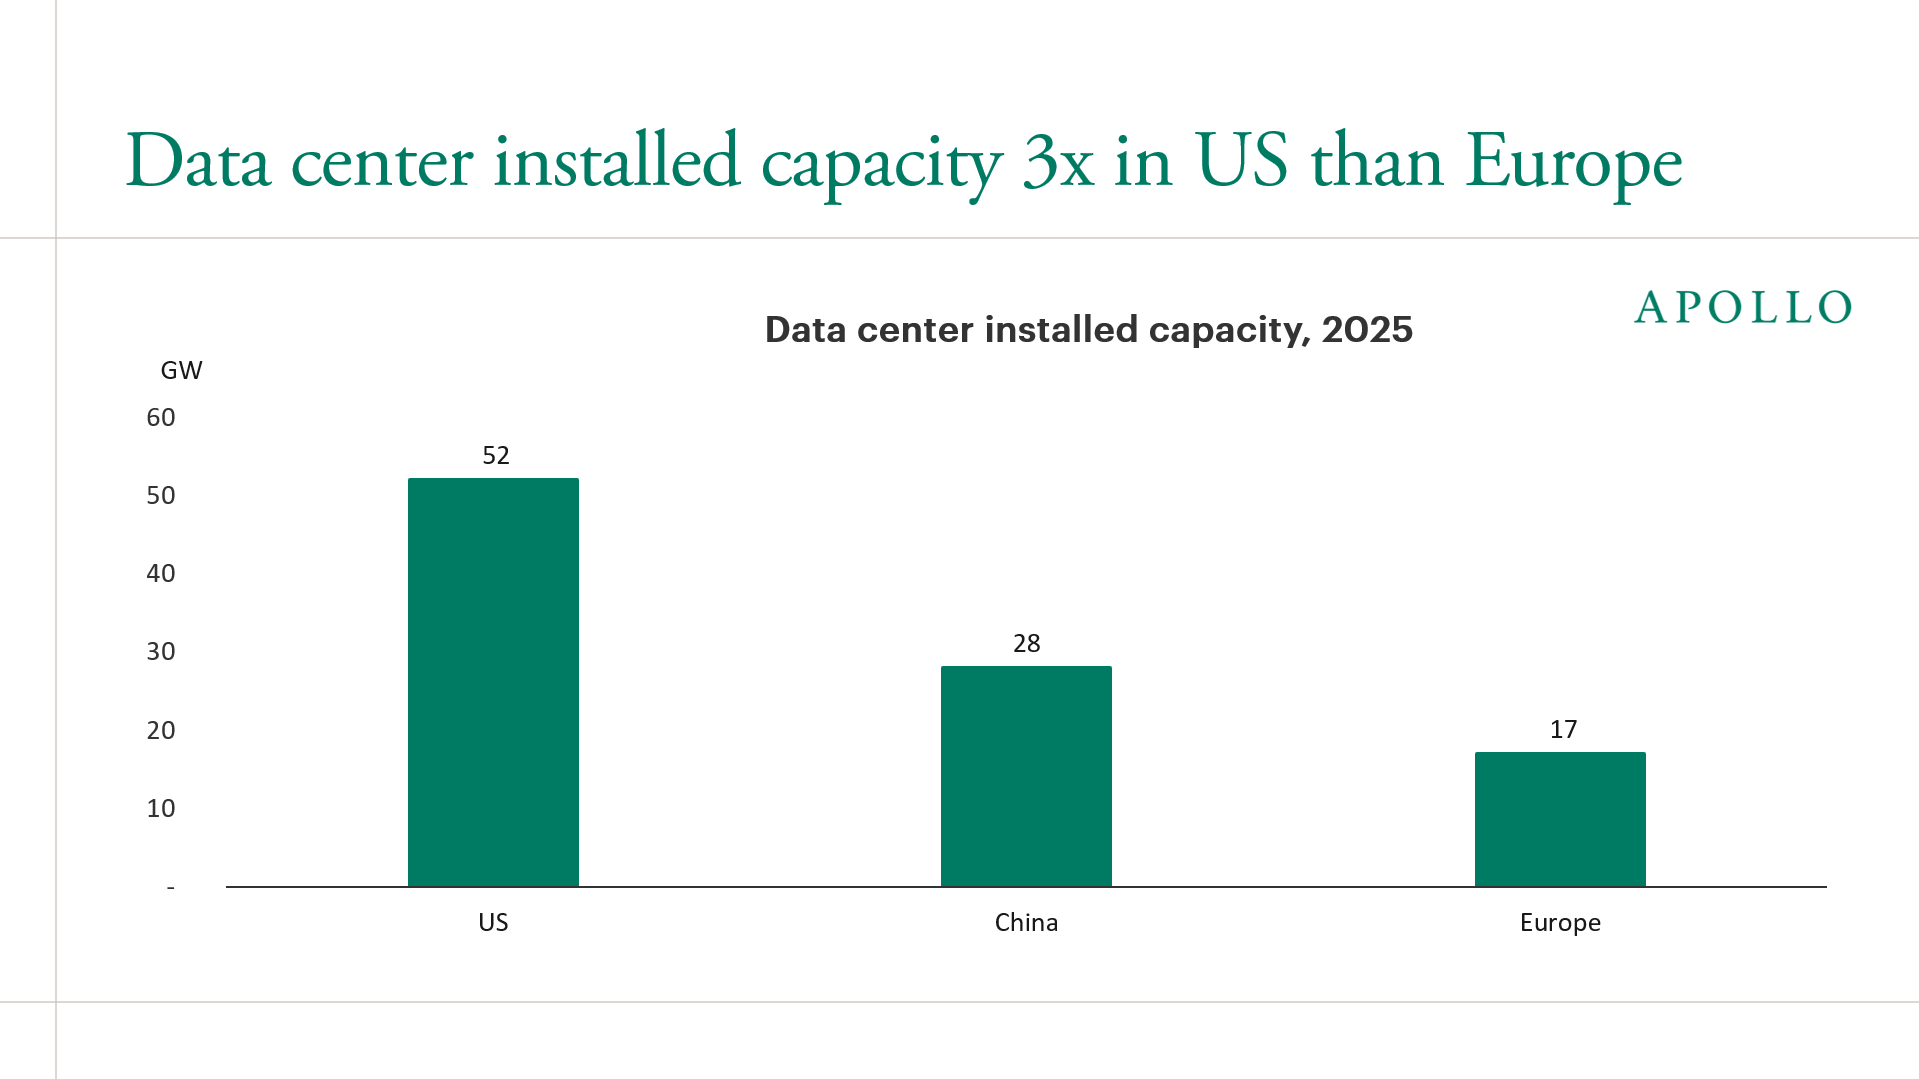
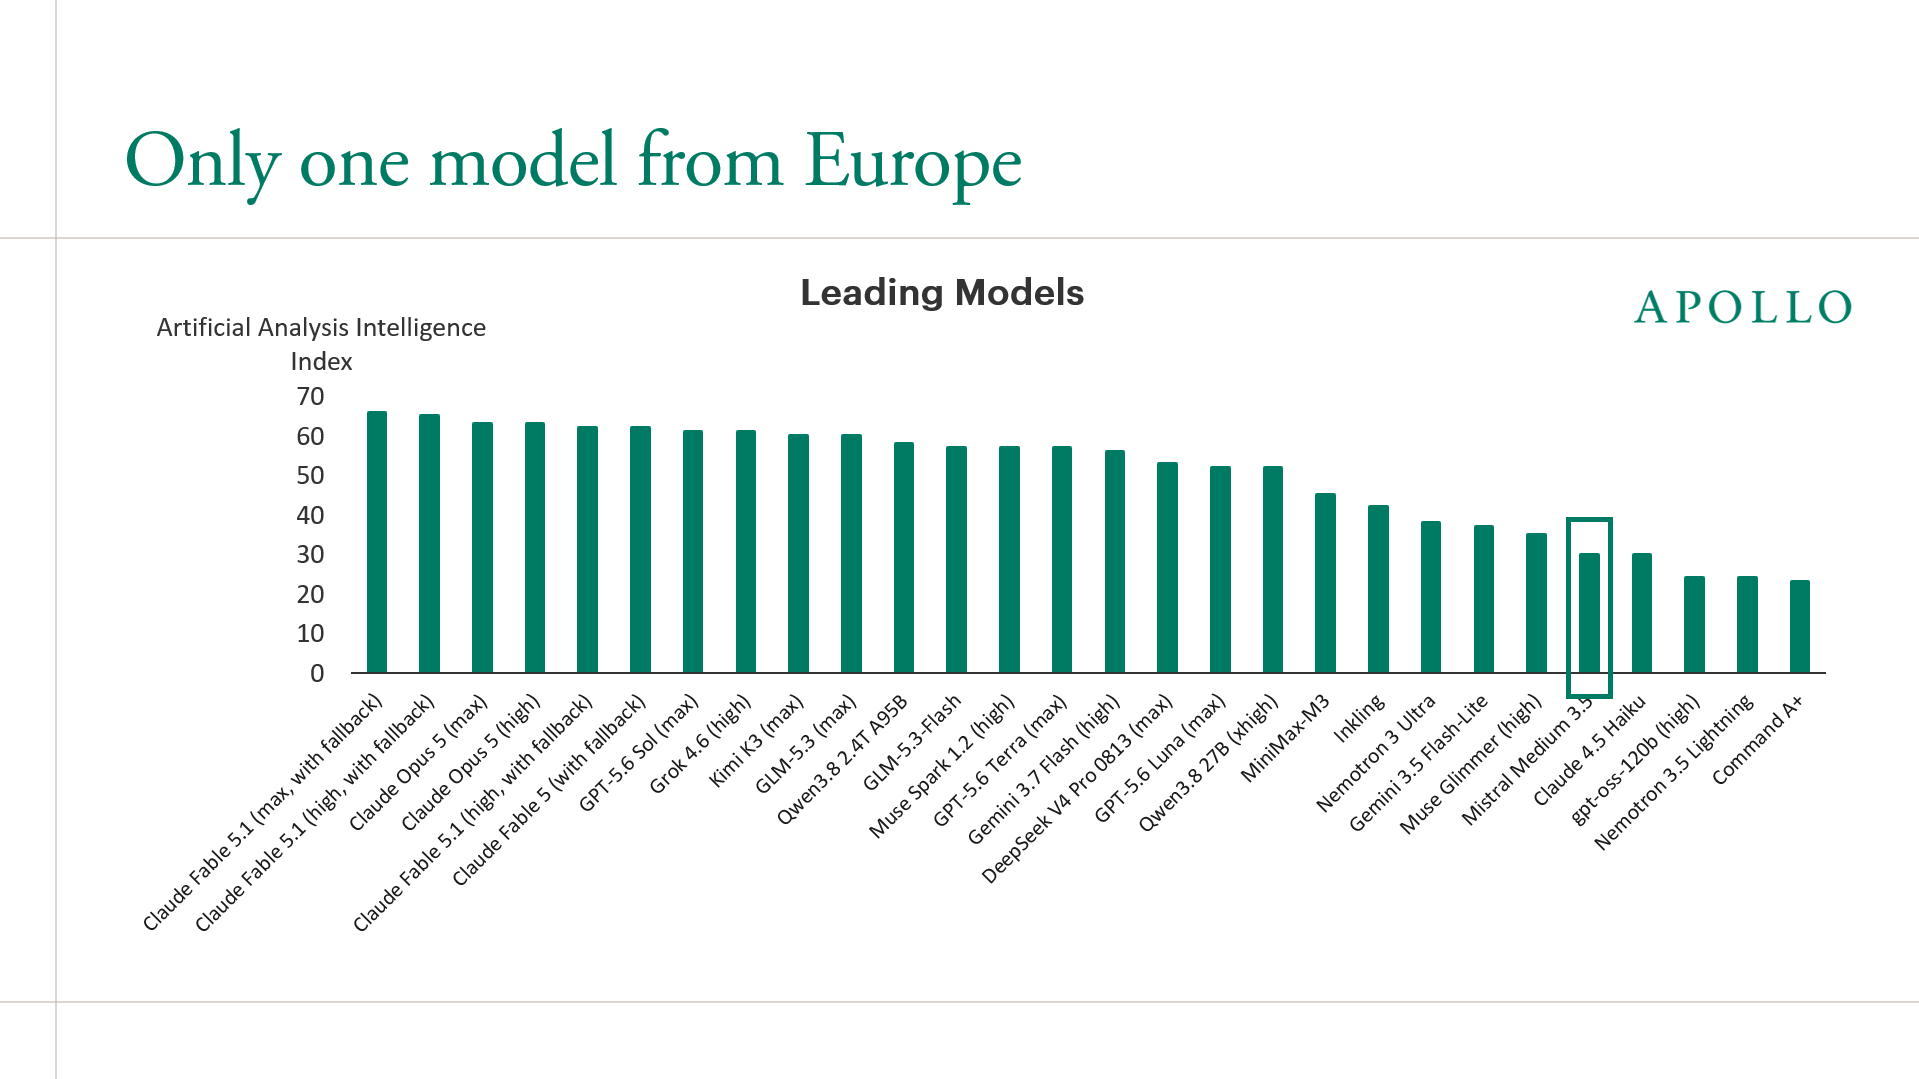
The US and Europe have fundamentally different roles in the AI economy. One is building it, and the other is using it. The US dominates on every supply-side measure: hyperscaler capex approaching $800 billion in 2026, data center capacity three times that of Europe and the dominant share of global AI models and semiconductor value, see the first three charts below.
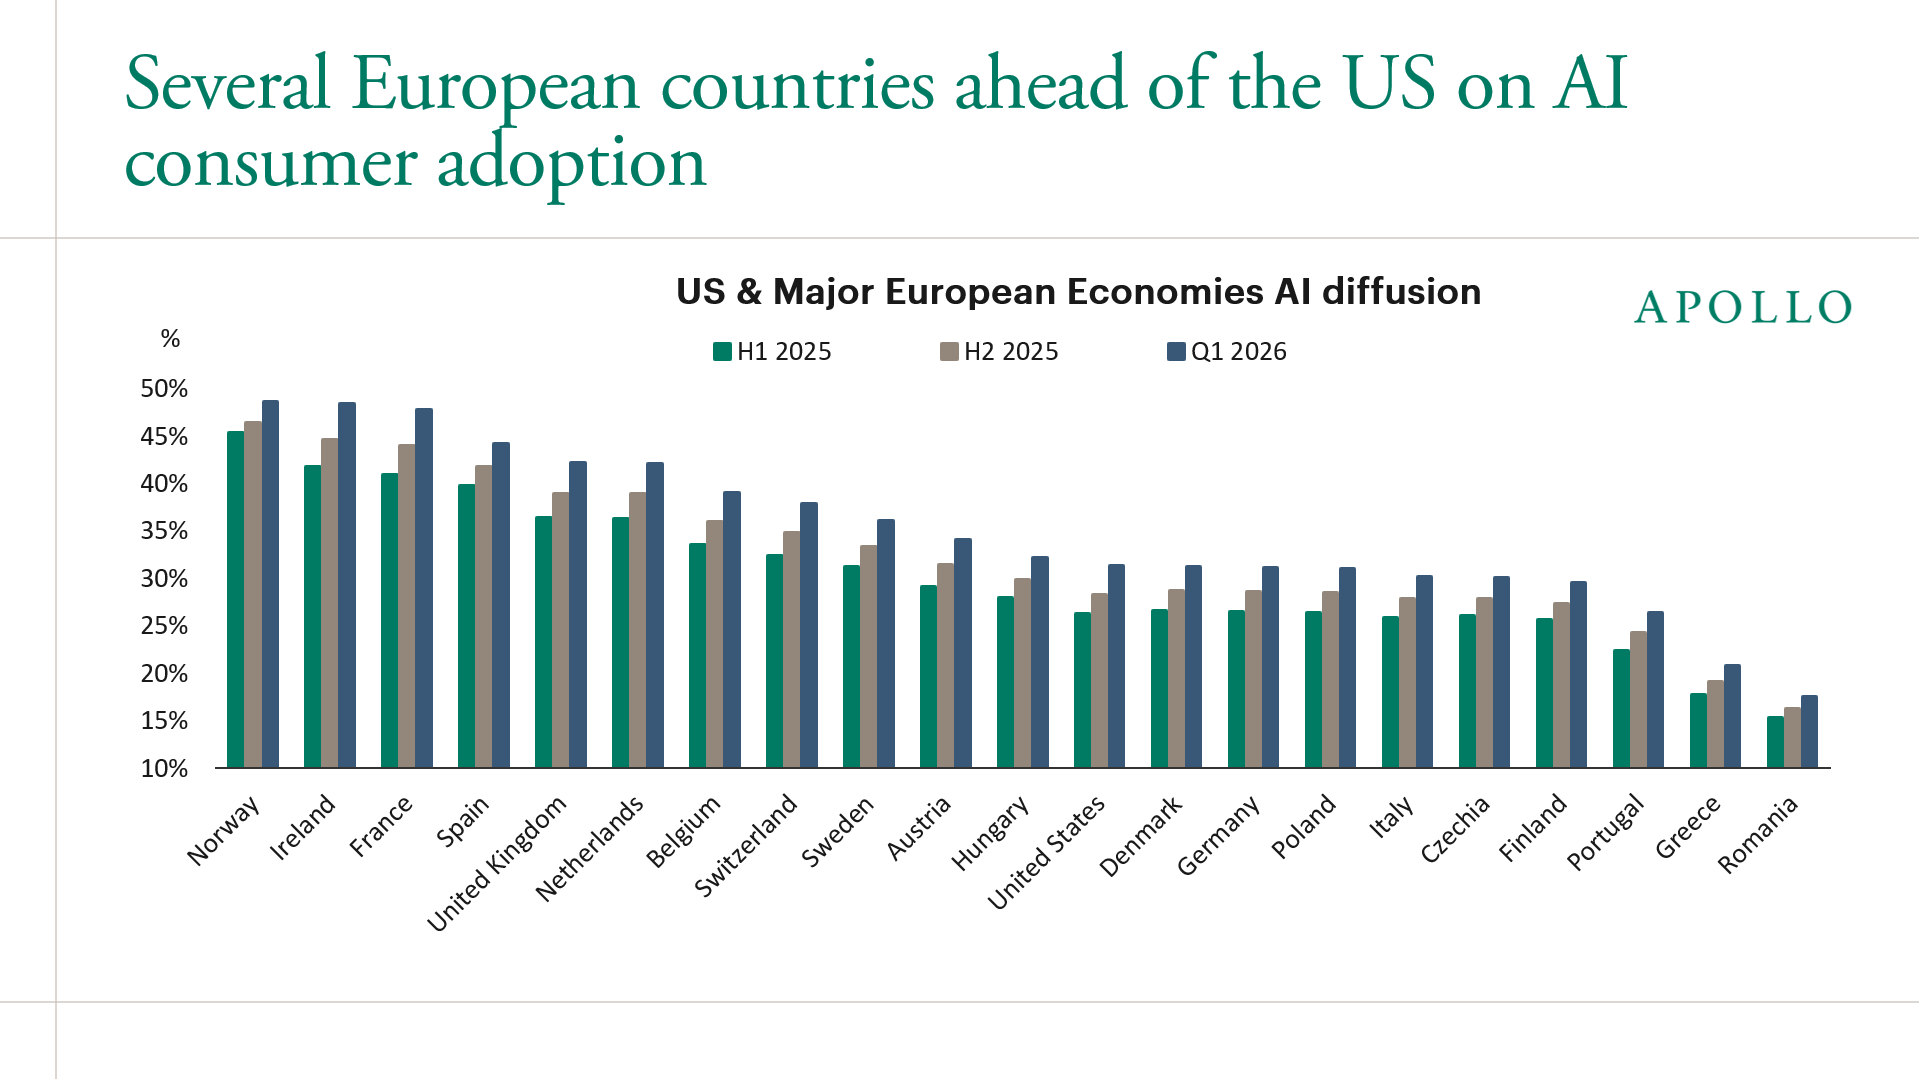
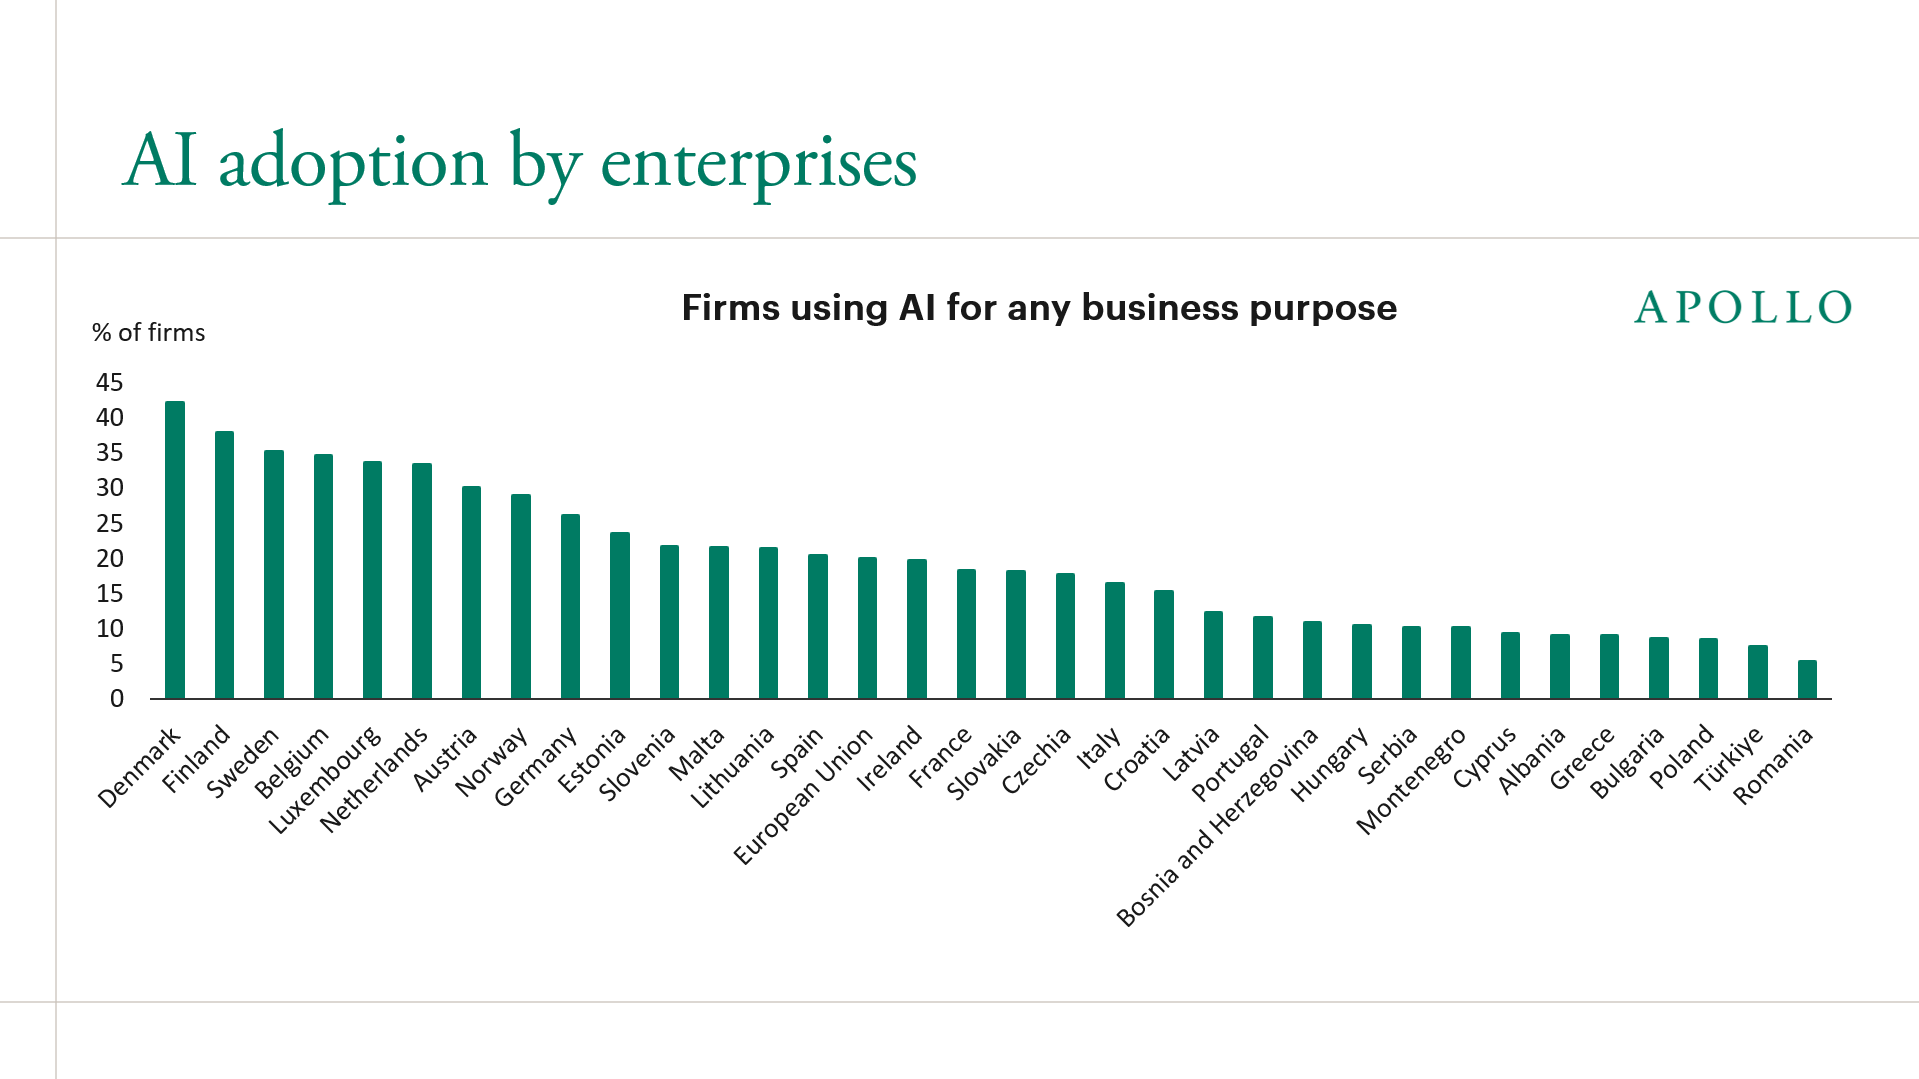
Yet on adoption, several European countries are actually ahead of the US, and many European firms are using AI in their businesses (see the fourth and fifth charts). This suggests Europe is an eager user of infrastructure it did not build and cannot easily replicate.
The bottom line is that the US is the dominant AI builder, but both the US and Europe are AI adopters. For more, see our new chart book: The macro implications of the AI investment boom: US and Europe
Written by Huw van Steenis
Sources: Factset, Apollo European and Policy Strategist, Apollo Chief Economist
Sources: IEA, Apollo European and Policy Strategist, Apollo Chief Economist
Sources: AI Model & API Providers Analysis | Artificial Analysis, Apollo European and Policy Strategist, Apollo Chief Economist
Note: AI diffusion is measured as the share of people between ages of 15 and 64 who have used a generative AI product. This measure is derived from aggregated and anonymized Microsoft telemetry and adjusted to reflect differences in OS and device-market share, internet penetration and country population. Sources: Global AI Diffusion in Q1 2026 - AI Economy Institute | Microsoft, Apollo European and Policy Strategist, Apollo Chief Economist
Note: Survey reports the share of firms using at least one of eight specified AI technologies: 1) text mining, 2) speech recognition, 3) natural language generation, 4) image recognition and processing, 5) machine learning for data analysis, 6) AI based software robotic process automation, 7) autonomous robots or drones, self-driving vehicles, 8) generating pictures, videos, sound/audio. Sources: Eurostat 2025 EU-ICT-Firm Survey, Apollo European and Policy Strategist, Apollo Chief Economist
See important disclaimers at the bottom of the page.
October 11, 2026
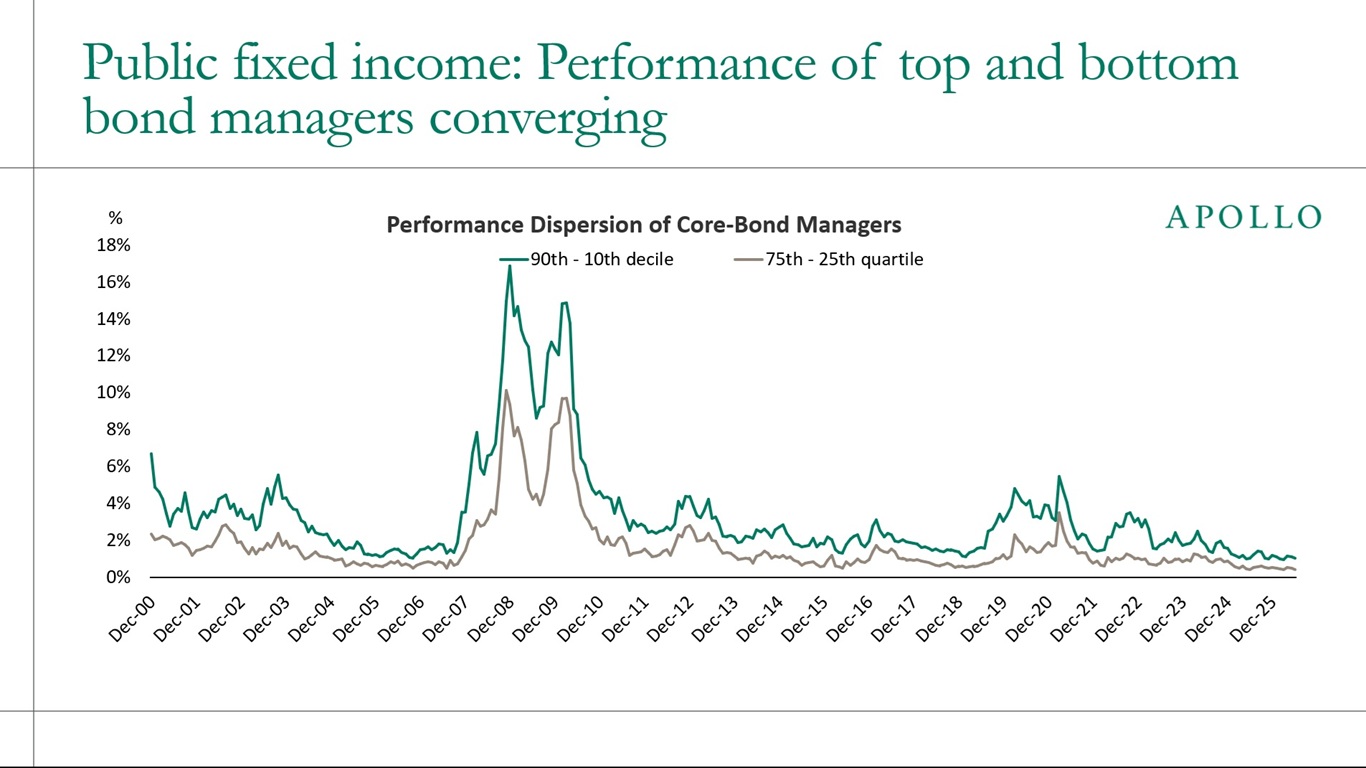
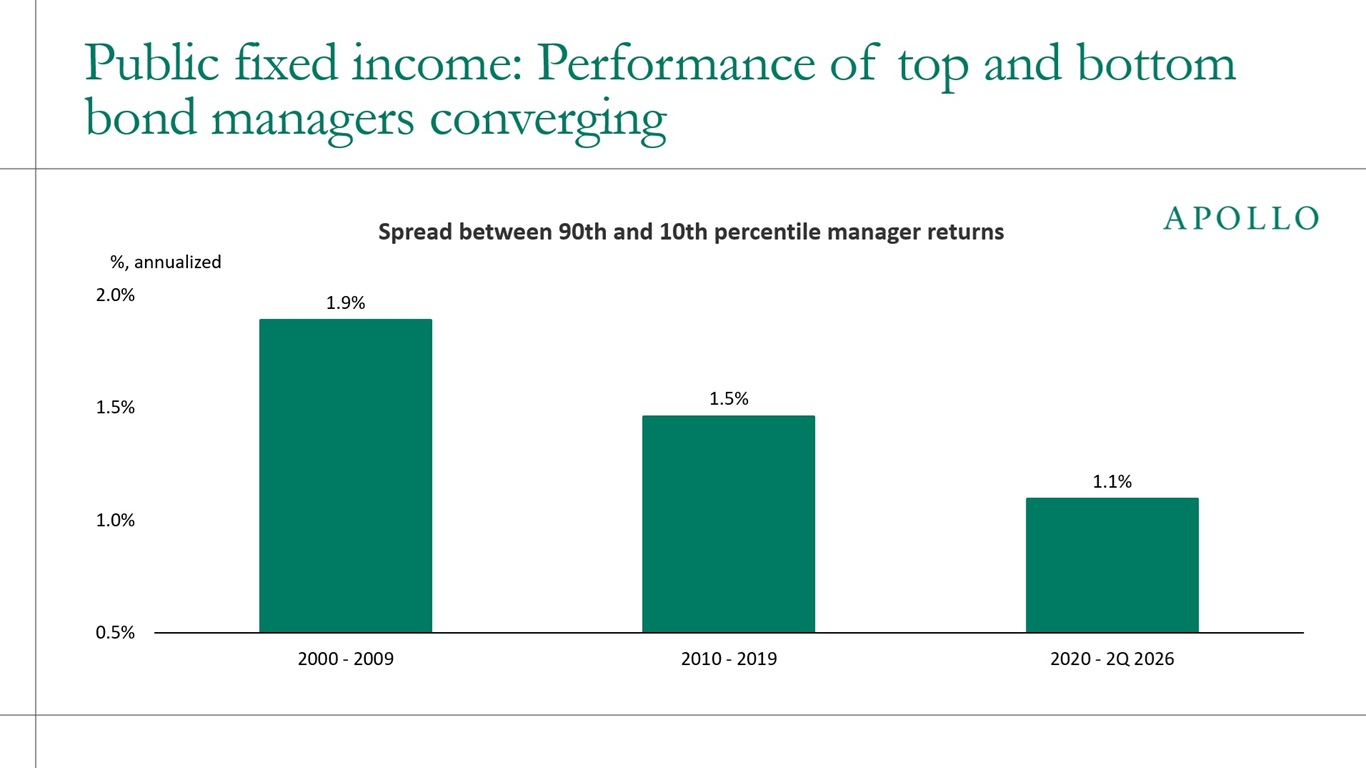
The gap between the 90th- and 10th-percentile public core bond managers has narrowed from 1.5% a year in the 2010s to 1.1% since 2020, see the first and second charts below. Dispersion now spikes mainly in crises and quickly falls back.
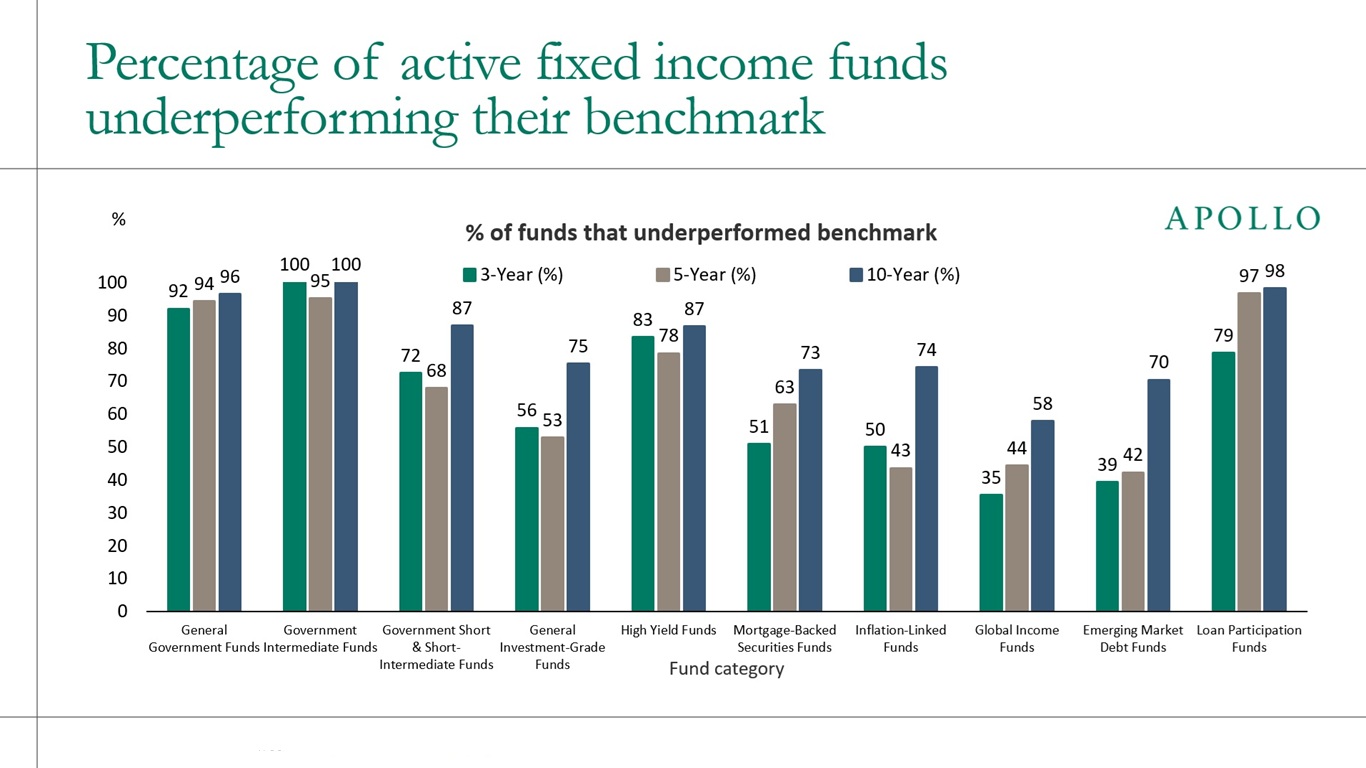
This convergence comes on top of persistent underperformance by public fixed income managers. For example, data from S&P shows that over the past 10 years, the majority of active Treasury fund managers have underperformed their benchmarks, see the third chart below.
The bottom line is that with little difference between top and bottom managers in public fixed income, and almost all of them trailing their index, public core fixed income has become essentially a beta allocation for both institutions and households.
Sources: Morningstar, Apollo Analysts
Note: Data as of June 30, 2026. Sources: SPIVA US Mid-Year 2026, Apollo Chief Economist
See important disclaimers at the bottom of the page.
Here are five new interesting papers that are relevant for the ongoing conversation in markets.
Written by Allison Boxer
See important disclaimers at the bottom of the page.
October 09, 2026
AI's rate-insensitive boom is triggering "Dutch disease" in the US economy by draining capital, power and labor from vulnerable sectors like housing and autos.
Trapped between inflation driven by the AI boom and weakness in rate-sensitive industries, the Fed will have to keep interest rates higher for longer, see chart below.
Because monetary policy cannot resolve this sectoral imbalance, the only durable fix is expanding the supply of power, chips and infrastructure.
For more discussion, see also here.
Sources: US Census Bureau, US Bureau of Economic Analysis, Macrobond, Apollo Chief Economist
See important disclaimers at the bottom of the page.