Macroeconomic Indicators & Trends

August 06, 2026

The AI Capex Boom Is Building Twice as Fast as the Housing Boom

About the Author
avatar
Torsten Slok

Partner, Chief Economist

Share

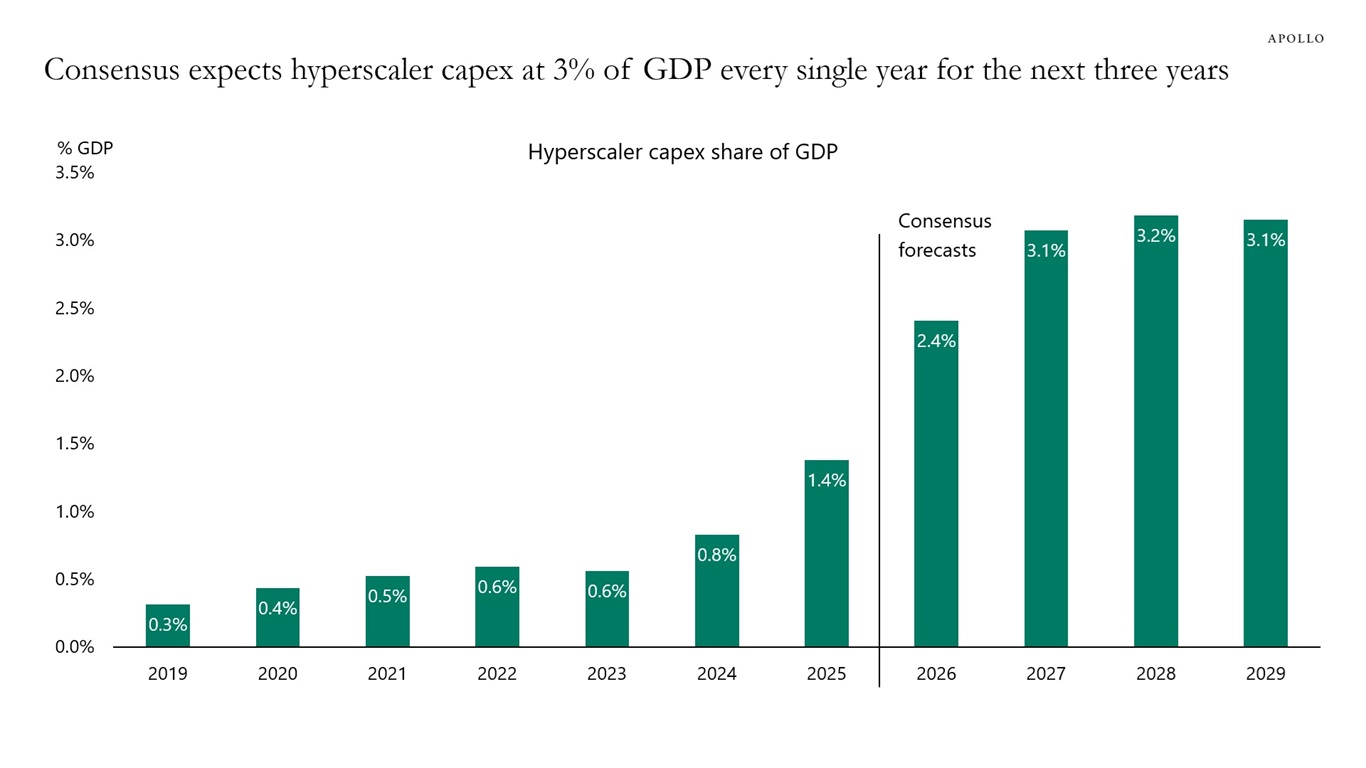
The first chart below shows that the consensus expects hyperscaler capex to run at roughly 3% of GDP every year from 2027 to 2029, up from 0.3% of GDP in 2019 and 1.4% in 2025.

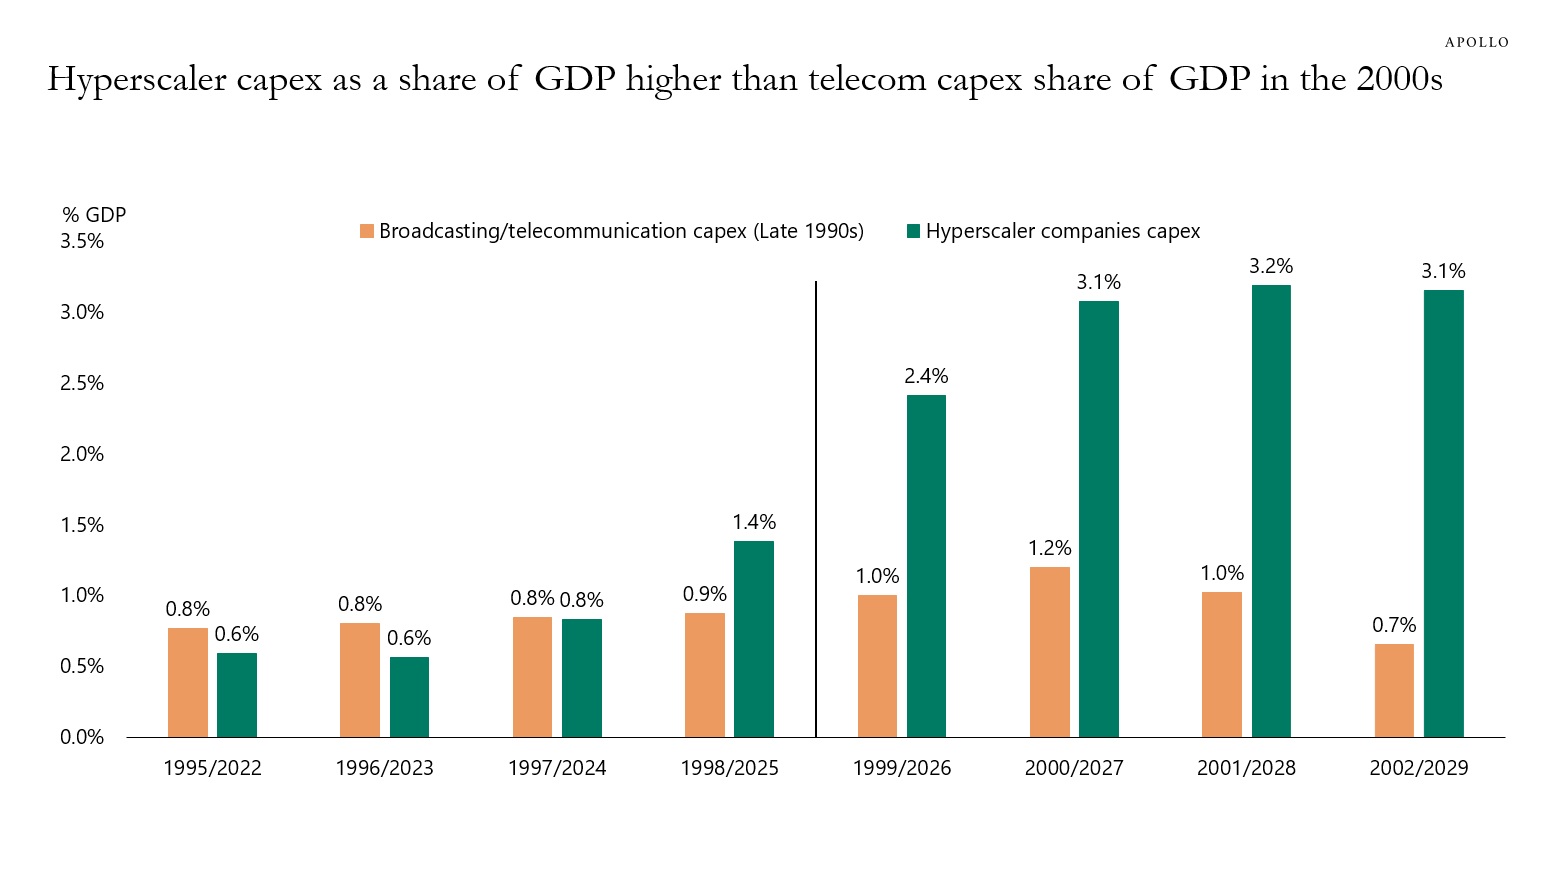
The second chart shows that this is more than twice the peak of the telecom and fiber buildout of the late 1990s, which topped out at 1.2% of GDP in 2000 before collapsing and tipping the economy into the mildest post-war recession.

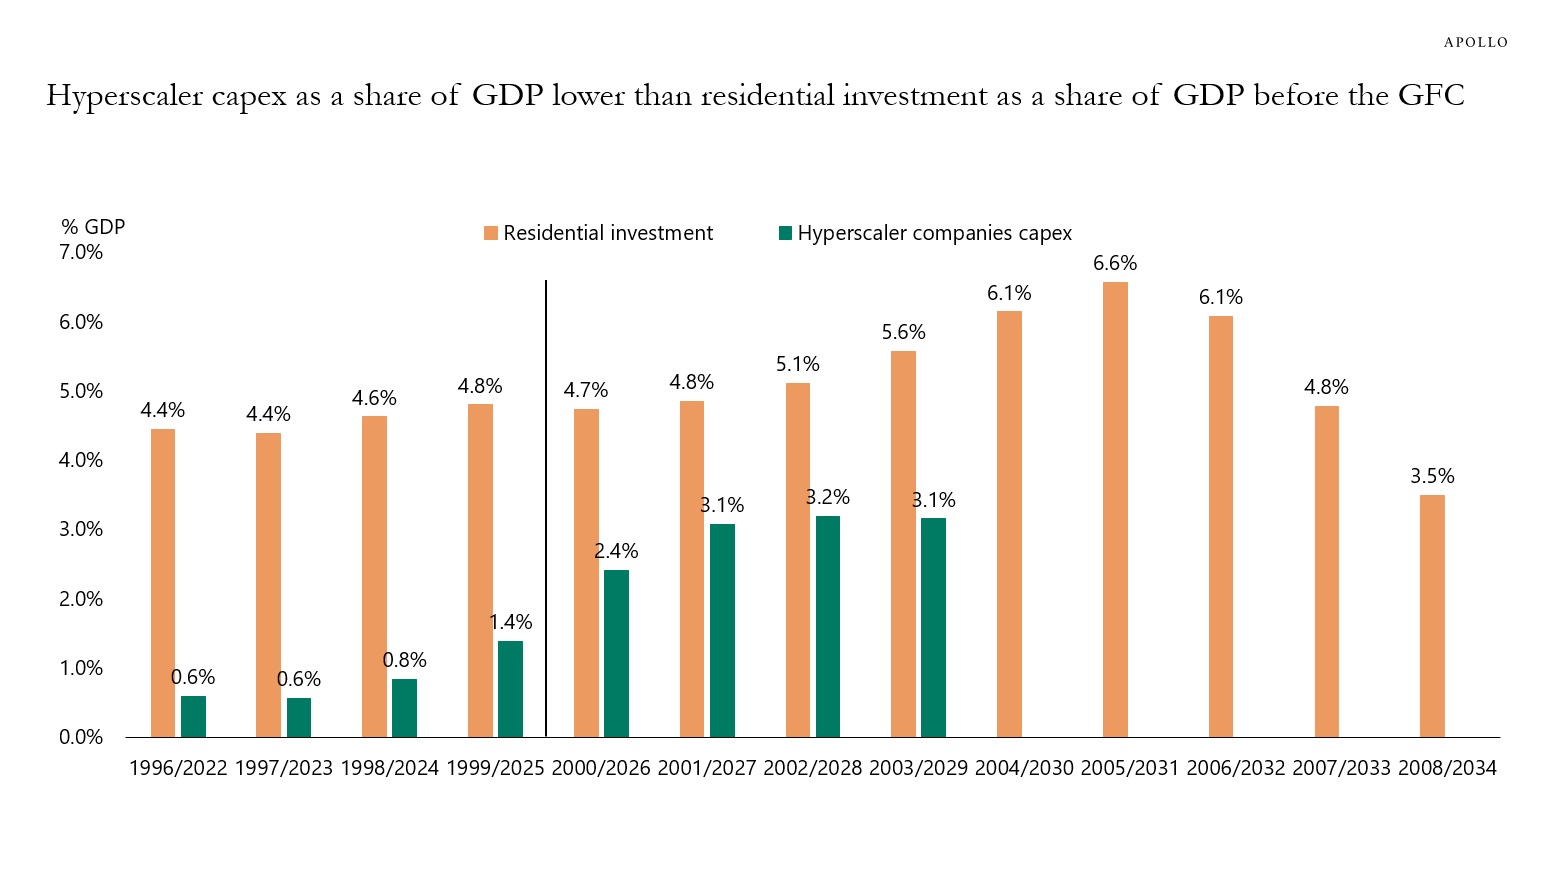
The third chart shows that the data-center buildout is still less than half the size of the housing boom, which peaked at 6.6% of GDP in 2005.

There are three ways to look at this data:

  1. In level, the ongoing data-center buildout sits between the fiber and housing cycles: more than twice the fiber peak, less than half the housing peak.
  2. In cumulative change, what matters is not the level of the share but how much it moves, because that is what adds to or subtracts from GDP. On the data in these charts, data-center capex rises 2.5 percentage points, from 0.6% of GDP in 2023 to 3.1% in 2027, against 0.4 percentage points for telecom in the late 1990s and 2.2 percentage points for housing from the mid-1990s to 2005. On this measure, the data-center buildout is the bigger capex cycle.
  3. In speed, the contrast is sharper still, and it holds even when each cycle is measured over its own fastest stretch. Data-center capex adds 1.7 percentage points in just two years, from 1.4% of GDP in 2025 to 3.1% in 2027, or roughly 0.85 percentage points a year. Housing's quickest phase, from 5.1% in 2002 to 6.6% in 2005, ran at 0.5 percentage points a year, and telecom's at around 0.15. The AI cycle is building at close to twice the pace of the housing boom at its fastest.

The bottom line is that the data-center buildout is smaller than housing in level but larger in the change in share of GDP, and faster than either previous cycle.

The same arithmetic runs in reverse: housing's unwind, from 6.2% of GDP in early 2006 to 3.0% by the end of 2008, is what made that recession severe, while telecom's much smaller reversal produced the mildest one.

A cycle that builds at 0.85 percentage points a year can unwind at a similar pace, and that, rather than the buildout itself, is the macro risk if AI demand disappoints.

Download high-res charts


This presentation may not be distributed, transmitted or otherwise communicated to others in whole or in part without the express consent of Apollo Global Management, Inc. (together with its subsidiaries, “Apollo”).

Apollo makes no representation or warranty, expressed or implied, with respect to the accuracy, reasonableness, or completeness of any of the statements made during this presentation, including, but not limited to, statements obtained from third parties. Opinions, estimates and projections constitute the current judgment of the speaker as of the date indicated. They do not necessarily reflect the views and opinions of Apollo and are subject to change at any time without notice. Apollo does not have any responsibility to update this presentation to account for such changes. There can be no assurance that any trends discussed during this presentation will continue.

Statements made throughout this presentation are not intended to provide, and should not be relied upon for, accounting, legal or tax advice and do not constitute an investment recommendation or investment advice. Investors should make an independent investigation of the information discussed during this presentation, including consulting their tax, legal, accounting or other advisors about such information. Apollo does not act for you and is not responsible for providing you with the protections afforded to its clients. This presentation does not constitute an offer to sell, or the solicitation of an offer to buy, any security, product or service, including interest in any investment product or fund or account managed or advised by Apollo.

Certain statements made throughout this presentation may be “forward-looking” in nature. Due to various risks and uncertainties, actual events or results may differ materially from those reflected or contemplated in such forward-looking information. As such, undue reliance should not be placed on such statements. Forward-looking statements may be identified by the use of terminology including, but not limited to, “may”, “will”, “should”, “expect”, “anticipate”, “target”, “project”, “estimate”, “intend”, “continue” or “believe” or the negatives thereof or other variations thereon or comparable terminology.