Did You Miss The Latest?
  • Direct Lending: Strong Fundamentals, Shifting Dynamics
  • After 60/40: What if Traditional Equity Portfolio Diversifiers Are Falling Short?
Share

Where investors are paid for the extra risk today, and where they are not (yet).


Key Takeaways

  • The Treasury is the return every investment has to beat. With the ten-year Treasury around 5%, institutional real estate yields are approximately 0.6 percentage points more than a Treasury bond, a fifth of its long-run average, and about 0.9 points less than Baa-rated corporate bonds.
  • Investors are paid for the extra risk today in selective areas such as real estate lending (from conventional commercial to data centers), senior housing, certain types of retail and certain markets for apartments and warehouses where little new supply is coming.
  • We believe the opportunity can widen as $1.5 trillion of property loans come due in 2026–27. We are watching those maturities closely.

The ten-year Treasury rose above 5% in September 2026, a level it has reached only once since 2007, briefly in October 2023.1 With upward pressure on the yield curve, the spread between institutional real estate yields and the ten-year is about a fifth of its long-run average. Similarly, the all-sector NCREIF index yield is approximately 90 basis points less than Baa-rated corporate bonds, which historically yielded a little less than real estate, not more.2  The Treasury is a real benchmark again.

Our view is that real estate offers a selective set of opportunities despite elevated benchmark rates, and we believe that as market conditions change, more attractive opportunities are likely to emerge. We see opportunities today where current income or income growth pays for the excess risk over the ten-year Treasury. Where it does not yet, the conditions that would need to change are specific, which we describe in subsequent sections.

The question for each type of real estate is simple: is the investor paid for the risk?

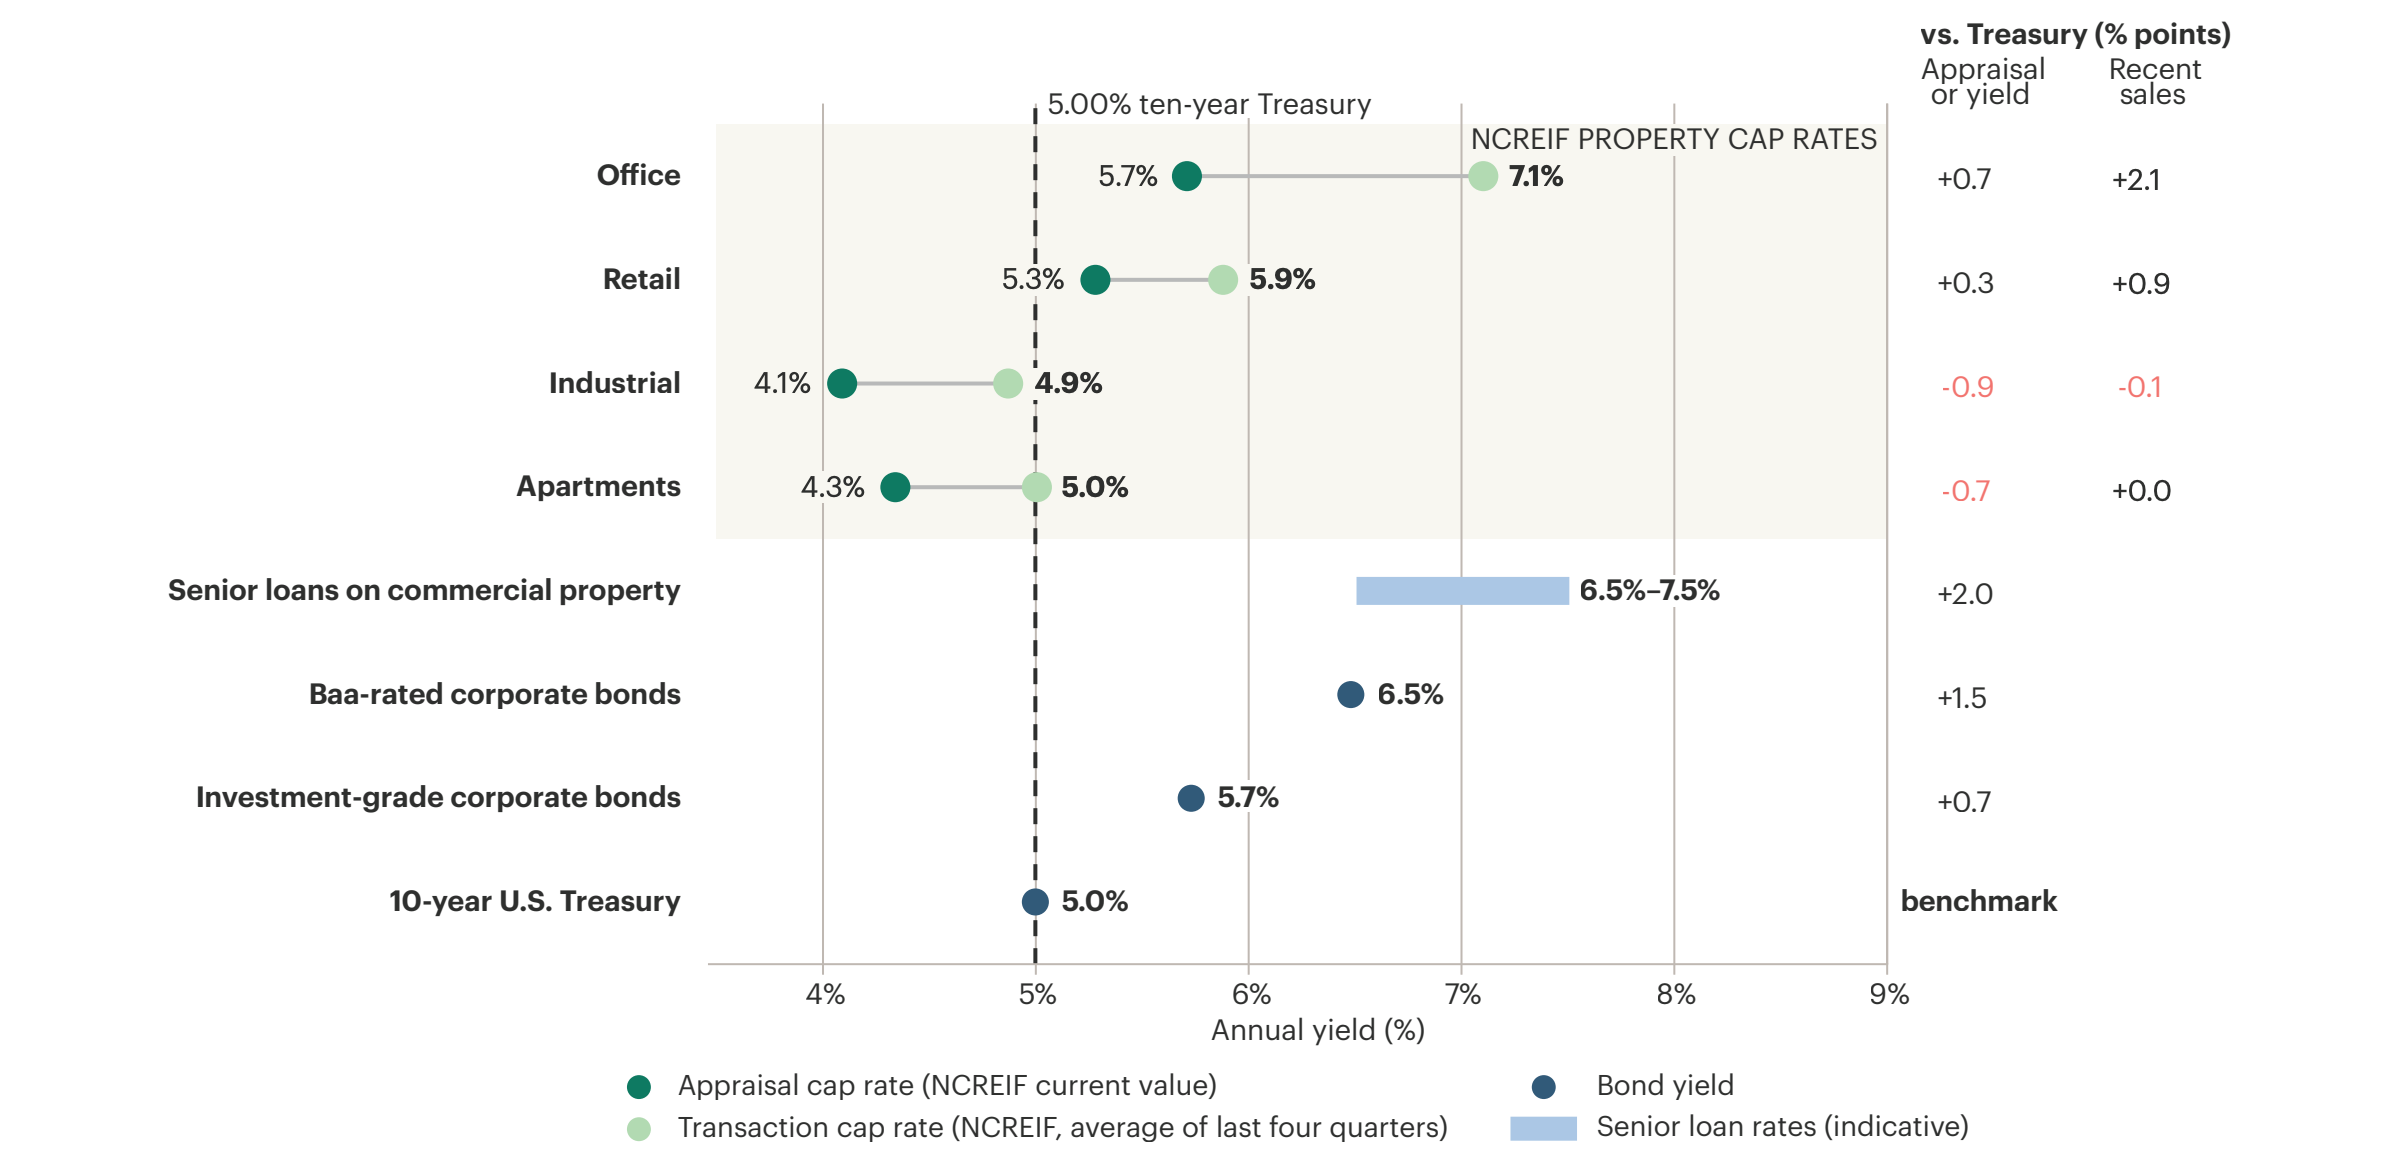
Exhibit 1: Real Estate Cap Rates Compared with Bond Yields at a 5% Treasury

Sources: Bloomberg (ten-year Treasury and SOFR swap, 9/15/2026); FRED (ICE BofA U.S. Corporate Index and Moody’s Baa yields, 9/15/2026); NCREIF NPI (2Q 2026): appraisal (current value) cap rates, value-weighted, and transaction cap rates, the simple average of NCREIF’s quarterly value-weighted transaction cap rates over the last four quarters. Senior loan rates are indicative ranges.

Investment-grade corporate bonds pay about 0.7 percentage points more than the ten-year Treasury and Baa-rated bonds about 1.5 points more. Senior loans on commercial property can carry fixed rates of roughly 6.5% to 7.5%, but risk matters from a spreads perspective—for example, pre-leased data center campuses can see lower rates of 6.25%.3

At first glance, a lender can earn more today than the owner of the building, depending on a variety of factors. Core apartments and warehouses yield about 4.1% to 4.3% on appraised values and about 5% on recent sales.4 Here’s the key difference: the coupon on a fixed-rate loan does not grow, but an owner’s income can.

As such, operations are more important today than in the past because income growth is where real estate equity earns its place in a portfolio. Recent performance in the manufactured housing communities (MHC) segment highlights our emphasis on operations. At the largest listed owners, site rental income rose about 6% in the year to the second quarter of 2026. With so little of the return paid up front, more of the return on equity depends on consistent growth over years, which leaves the sector more exposed to a higher Treasury.5 In our view, this example is one of several that reinforces our perspective: the opportunity set going forward cannot depend on lower rates. Real estate equity pays in the markets where rents are already rising and the basis is attractive. 

WHAT THIS COULD MEAN FOR INVESTORS

Real estate lending pays well above the Treasury, and retail and office properties are selling at yields above it (note: Office fundamentals are structurally impaired); apartments and warehouses are selling at roughly the Treasury yield, so for owners income growth has to make up the difference. 

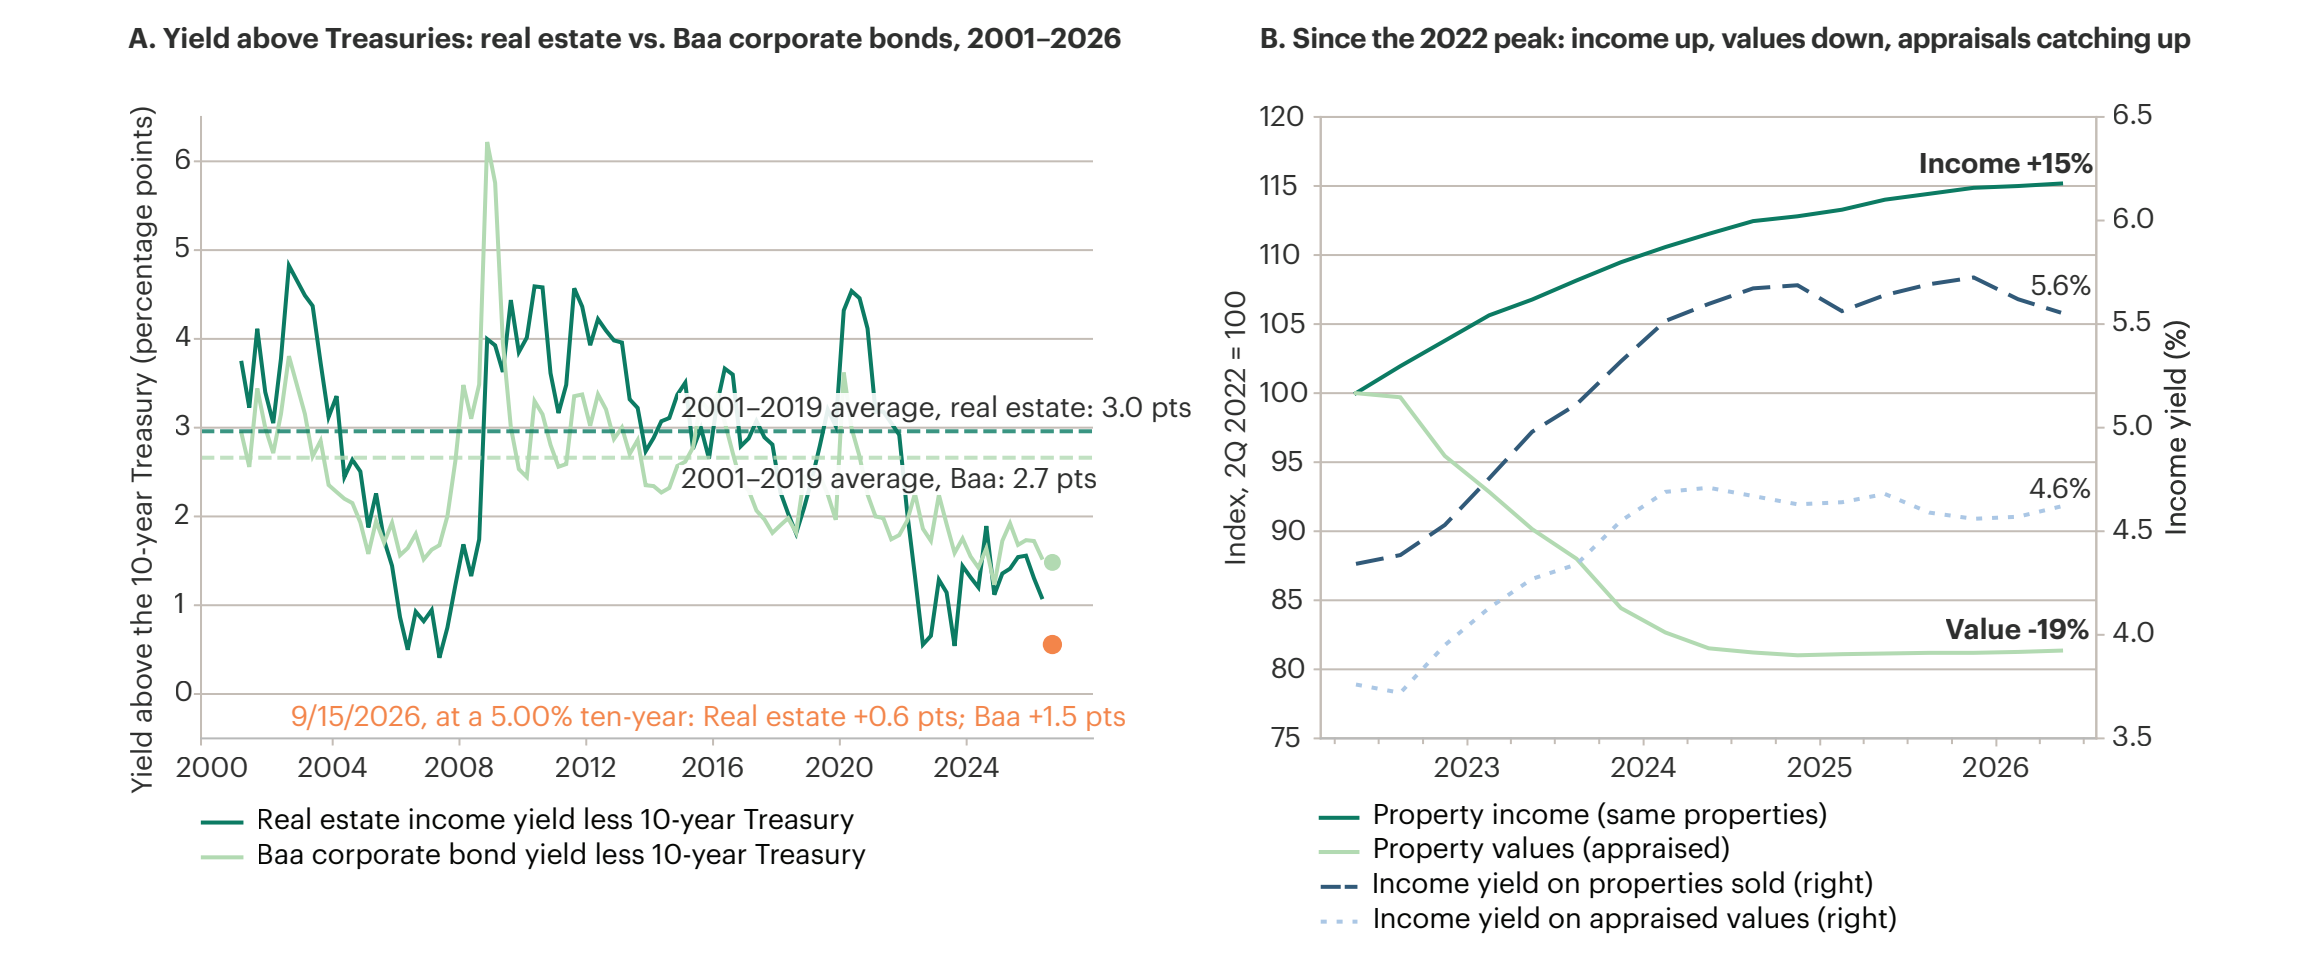
Exhibit 2: How We Got Here: Benchmark Interest Rates Rose 3.5 Points While Property Yields Increased 1.2 Points— Appraised Values Have Yet to Catch Up

Paired charts comparing real estate and Baa bond yield spreads over Treasuries from 2001 to 2026, and property income, values, and yields since the 2022 peak.
Sources: Panel A: NCREIF NPI transaction cap rates (all property; simple average of NCREIF’s last four quarterly value-weighted rates) less the 10-year Treasury; Moody’s Baa corporate bond yield less the 10-year Treasury; quarter-end, 1Q 2001–2Q 2026 (Bloomberg); 9/15/2026 points at a 5.00% ten-year. Panel B: NCREIF NPI, all property: value index chained from capital returns; net operating income growth for a constant set of properties, chained and smoothed over trailing four quarters; transaction cap rates (same measure) and on appraised values, 2Q 2022–2Q 2026.

Since property values peaked in the second quarter of 2022, the ten-year Treasury has risen about 3.5 percentage points and property income yields (cap rates) about 1.2 points.6 Income held up: net operating income from NCREIF’s Property Index (a constant set of institutional properties) is up about 15% while values are down about 19%, and occupancy in core apartments, warehouses, and retail remains above its thirty-year average.7 The decline was caused by interest rates, not weaker buildings, and it shows most clearly in actual sales: properties sold over the past ten quarters changed hands at income yields roughly 1 percentage point above appraised values, twice the normal gap, while appraised values have been flat for six quarters.8

Real estate’s yield advantage over Treasuries has been narrower than that of Baa bonds since 2022, as Panel A shows; the last time that held for this long was 2005–09.9 The advantage narrowed further because the ten-year rose nearly a full percentage point since our March paper Why Real Estate in 2026, and property yields have not followed, as buyers and sellers resist repricing. This is not unexpected as values lag faster-moving public market conditions. What matters from here is income, and Exhibit 3 shows where income is protected.

WHAT THIS COULD MEAN FOR INVESTORS

The repricing has happened in actual sales but has yet to be reflected in appraisals. For investors in strategies valued by appraisal, we argue for reading reported values alongside sale prices.

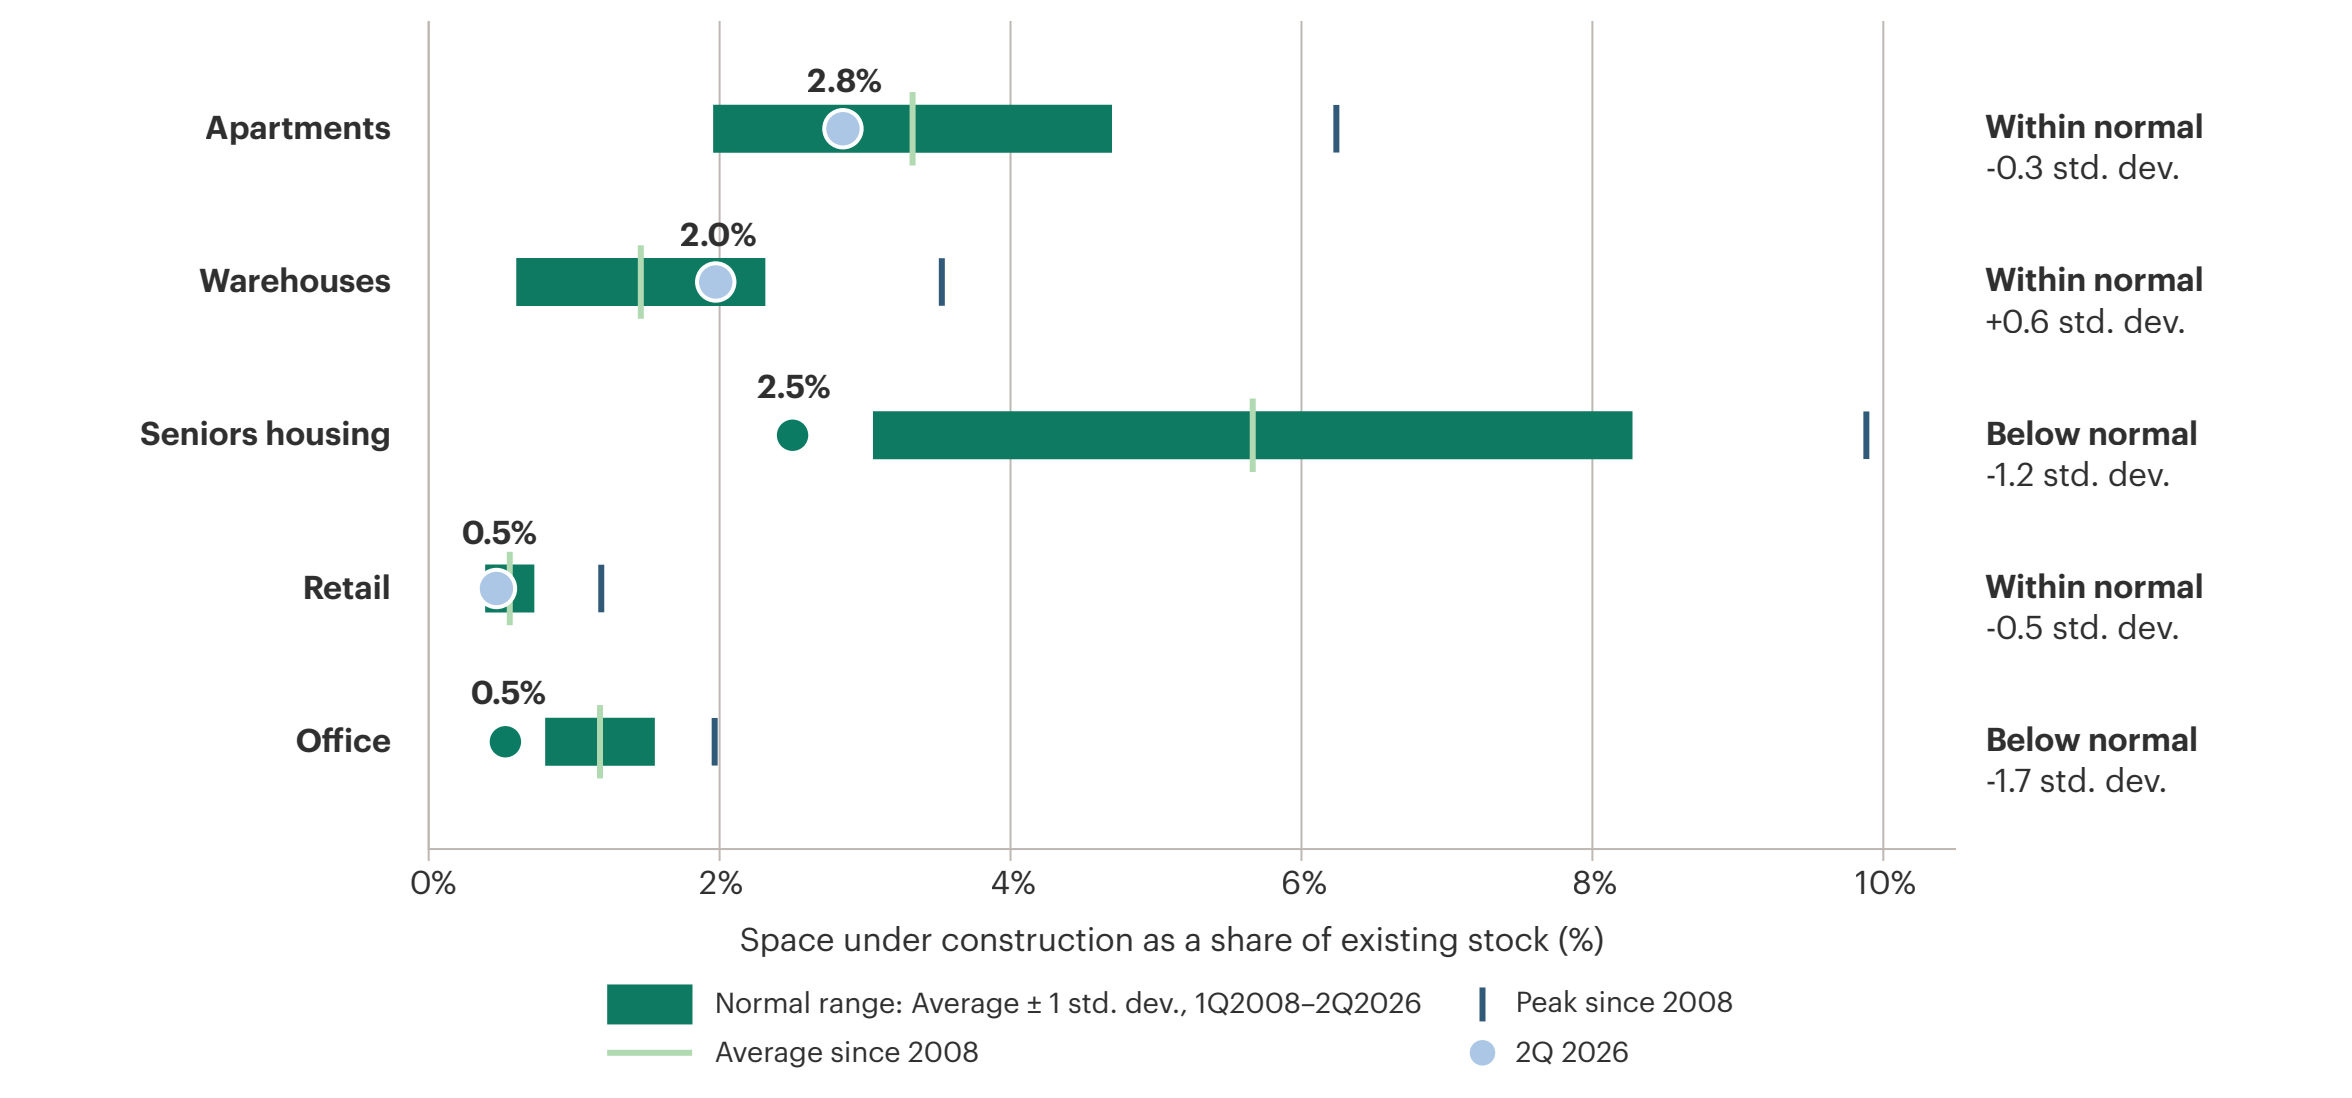
Exhibit 3: Where Income is Protected: New Supply is Back Within its Normal Range, and Below it in Seniors Housing and Office

Chart comparing 2Q 2026 space under construction as a share of existing stock with the post-2008 average, normal range, and peak for five property types.
Sources: CoStar (apartments, warehouses, office, retail; 394 U.S. markets aggregated; as of 3Q 2026); NIC MAP Vision (seniors housing, Primary Markets, independent and assisted living unit-weighted, 2Q 2026). Space under construction as a percentage of existing stock, 2Q 2026, against each sector’s average and one standard deviation either side of it over 1Q 2008–2Q 2026.

Higher rates have done what they typically do to real estate development pipelines. Apartments under construction have fallen by more than half from the 2023 peak, the largest pipeline going back decades, and have returned to about their average since 2008. New starts are nearly two-thirds below their 2022 pace, and apartment vacancy, which peaked at 7.0% at the end of 2025, has begun to fall.10 Seniors housing construction is running at less than a third of its pre-pandemic pace, with occupancy above 2019 levels and rents up near 5% over the past year.11 Warehouses are the exception: construction remains above its average since 2008, vacancy is rising, and leasing is at a fifteen-year low— accordingly, only select markets pay for the risk today.12 

Demand dynamics did not collapse when rates rose— but, depending on the sector, rates have impacted fundamentals to some degree. Notable facts support demand tailwinds. Owning a median-priced home costs about $775 a month more than renting, and first-time buyers are a fifth of purchases, the lowest share on record.13 The population aged 65 and over has grown 16% since 2020, to 64.6 million.14 Spending on artificial intelligence has taken data center vacancy in major markets to 1.4%, with 80% of a record pipeline already leased.15 Lower immigration, with net international migration down by more than half from its 2024 peak, is why we view the apartments sector market by market: attractive now in supply-constrained coastal and mid-sized markets where rents are already rising; a recovery opportunity at reset prices in the Sunbelt markets that overbuilt, once their pipelines are absorbed; and wait where supply is low but vacancy is high.16   

WHAT THIS COULD MEAN FOR INVESTORS

Supply has not stopped, but its magnitude as a headwind is not what it was in 2023 and 2024. Where construction is below its normal range and demand is structural, as in seniors housing, existing assets hold pricing power, and that is where income has been growing. In our view, that is where focus should be today. 

Exhibit 4: What Would Widen the Opportunity Set

None of these factors above suggest a permanent exclusion or lower long-term conviction. For real estate equity to be compelling, any of three things would help: stronger income growth, borrowing costs falling below property income yields (which the market does not currently price), or lower purchase prices—and the volume of loans coming due may encourage this in the near term. There are $875 billion of commercial property loans scheduled to mature in 2026 and $652 billion in 2027, about 30% of all such debt, and roughly a fifth of 2025’s maturities were extended rather than repaid.17 By the third quarter of 2026, banks were easing lending standards in all three categories of commercial property loans for the first time since 2022, which we view as a precondition for refinancings to clear.18


WHAT THIS COULD MEAN FOR INVESTORS

The triggers in Exhibit 4 highlight the difference between waiting and timing. Investors holding capital for core property may find better entry points as loans come due over the next two years. Investors in real estate debt are paid while they wait.

Real estate works in a 5% world. Judged against the Treasury, real estate offers a select set of opportunities today. The Treasury is the benchmark again, and each investment has to beat it, priced accordingly for its risk.

Price and income, not falling rates, drive returns from here. Half of the last cycle’s return came from rising values,19 and we have observed the same pattern in private equity.20 From here the return is income, income growth, and purchase price. Lower debt and rising property income are what drive returns; waiting for values to be marked up is not.

The opportunity set today is selective. Real estate lending, seniors housing, certain types of retail, and core property in the markets where little was built are a few examples of what pays today. Each pays more than the Treasury now, on income that is contractual, demographic-driven, or protected by limited new supply.

The opportunity can widen from here. There are $1.5 trillion of loans coming due in 2026–27 while construction has fallen back from record levels. If prices and lending rates converge, we see opportunities across core properties, the Sunbelt apartment markets, and in time new development would come back into favor as pricing power recovers. We are watching the inflection points.

For long-term investors, 2026 is a moment to be selective: to take the returns that are visible today, to hold capital for the ones that may follow, and to let income do the work that falling interest rates did last cycle.

Download the Article

Exhibit 4: Source:  NCREIF NPI (2Q 2026); Green Street (3Q 2026); CoStar (3Q 2026); NIC MAP Vision (2Q 2026); Federal Reserve Senior Loan Officer Opinion Survey (3Q 2026); Mortgage Bankers Association, 2025 Commercial Real Estate Survey of Loan Maturity Volumes (February 2026); Bloomberg (interest rate swaps, 9/15/2026). Loan-rate ranges are indicative; core inflation refers to core CPI, 2.6% year over year in September 2026. 

End Notes:

1. Bloomberg. The ten-year Treasury yield traded at 5.01% intraday on September 14, 2026 and 5.00% on September 15, 2026. The ten-year last reached 5% intraday in October 2023; its last close at or above 5% was in July 2007. The 2026 move has been almost entirely a real-yield move: the ten-year rose 83 basis points from December 31, 2025 to September 15, 2026, of which 72 basis points was the ten-year TIPS yield (1.90% to 2.62%) and 13 basis points the breakeven inflation rate.

2. NCREIF NPI all-property transaction cap rate (income yield on properties sold), simple average of NCREIF’s last four quarterly value-weighted rates: 5.56% at 2Q 2026, about 0.6 percentage points above the ten-year on September 15, 2026 (5.00%), against a 2001–2019 average spread of 2.96 points; the current reading is in the bottom 5% of quarterly observations since 2001. Moody’s Baa corporate bond yield 6.48% on September 15, 2026 (FRED series DBAA), 1.48 points above the ten-year, against a 2001–2019 average of 2.66 points. Investment-grade corporate spreads are similarly narrow (ICE BofA U.S. Corporate Index option-adjusted spread 0.78 points on September 15, 2026, against a 2001–2019 average of 1.58). Real estate’s spread to Treasuries has been below the Baa spread in 16 of the 17 quarters since 2Q 2022; over 2001–2019 it averaged 0.30 points above the Baa spread. Before 2022, real estate’s spread was more than half a point below the Baa spread only in 2006–09 and briefly in 2015.

3. ICE BofA U.S. Corporate Index effective yield 5.73% on September 15, 2026 (FRED series BAMLC0A0CMEY). Senior real estate credit: indicative all-in fixed coupons of 6.5% to 7.5% for conduit and life company loans (ten-year SOFR swap 4.61% on September 15, 2026 plus loan spreads of roughly 175 to 275 basis points) and 6.3% to 6.8% for agency multifamily. Data center financing: CBRE, North America Data Center Trends H1 2026 (August 27, 2026): $27.8 billion of high-yield issuance in twelve transactions in the first half, including a $5.7 billion financing at 6.25% for a fully leased 430 MW campus.

4. NCREIF NPI, 2Q 2026. Appraisal (current value) cap rates, value-weighted: apartments 4.3%, industrial 4.1%, retail 5.3%, office 5.7%. Transaction cap rates: simple average of NCREIF’s quarterly value-weighted transaction cap rates, 3Q 2025–2Q 2026: apartments 5.0% (126 sales over the four quarters), industrial 4.9%(288), retail 5.9% (77), office 7.1% (80). Each quarter is weighted equally, so quarters with few sales (for example, six office sales in 1Q 2026) count as much as larger ones. Transaction cap rates reflect the properties that sold, which may differ from the index as a whole. 

5. Northmarq, ”Manufactured Housing Communities Poised for Growth in 2026” (February 17, 2026): average cap rate across manufactured housing community sales 5.9% in the first half of 2025; ten-year Treasury 5.00% on September 15, 2026. Largest listed owners, quarter ended June 30, 2026 vs. the same quarter of 2025: Equity LifeStyle Properties, core portfolio manufactured housing base rental income +5.8% (average monthly base rent per site $956 vs. $904); Sun Communities, same-property manufactured housing revenue +6.2% and net operating income +8.8%. Core CPI 2.6% year over year in September 2026.

6. Bloomberg: ten-year Treasury 1.5% at 4Q 2021, 5.00% on September 15, 2026. NCREIF NPI all-property transaction cap rate (simple average of the last four quarterly value-weighted rates): 4.3% at 2Q 2022, 5.6% at 2Q 2026.

7. NCREIF NPI, all property, 2Q 2022–2Q 2026: same-property NOI growth chained (+15%); capital value index chained from capital returns (−19%). NCREIF NPI percent leased, 2Q 2026 vs. 1990–2019 average: residential 94.2% vs. 93.6%; industrial 95.0% vs. 92.1%; retail 93.2% vs. 92.6%; office 86.6% vs. 88.3%.

8. NCREIF NPI transaction cap rate (simple average of the last four quarterly value-weighted rates) less current-value (appraisal) cap rate: 83 to 116 basis points in the ten quarters from 1Q 2024 to 2Q 2026, averaging about 99, against a 2011–2019 average of 53 basis points. 2Q 2026: transaction 5.6%, appraisal 4.6%.

9. From note #2: NCREIF NPI all-property transaction cap rate (income yield on properties sold), simple average of NCREIF’s last four quarterly value-weighted rates: 5.56% at 2Q 2026, about 0.6 percentage points above the ten-year on September 15, 2026 (5.00%), against a 2001–2019 average spread of 2.96 points; the current reading is in the bottom 5% of quarterly observations since 2001. Moody’s Baa corporate bond yield 6.48% on September 15, 2026 (FRED series DBAA), 1.48 points above the ten-year, against a 2001–2019 average of 2.66 points. Investment-grade corporate spreads are similarly narrow (ICE BofA U.S. Corporate Index optionadjusted spread 0.78 points on September 15, 2026, against a 2001– 2019 average of 1.58). Real estate’s spread to Treasuries has been below the Baa spread in 16 of the 17 quarters since 2Q 2022; over 2001–2019 it averaged 0.30 points above the Baa spread. Before 2022, real estate’s spread was more than half a point below the Baa spread only in 2006–09 and briefly in 2015. 

10. CoStar, 394 U.S. markets, as of 3Q 2026: multifamily under construction 2.85% of inventory at 2Q 2026 vs. 6.24% at the 1Q 2023 peak and a 2015–19 average of 3.75%; first-half 2026 starts annualized at about 290,000 units vs. 723,000 in 2022; deliveries 686,000 units in 2024 and 523,000 in 2025; stabilized vacancy 6.98% at 4Q 2025 and 6.73% at 2Q 2026. U.S. Census Bureau, New Residential Construction: units in buildings of five or more under construction 666,000 in August 2026 vs. a record 1,001,000 in July 2023. Under construction as a share of existing stock, 1Q 2008–2Q 2026 average and standard deviation: apartments 3.3% (1.4 points), 2Q 2026 reading 0.3 standard deviations below average; warehouses 1.5% (0.9), 0.6 above; retail 0.6% (0.2), 0.5 below; office 1.2% (0.4), 1.7 below; seniors housing (NIC MAP) 5.7% (2.6), 1.2 below.

11. NIC MAP Vision, Primary Markets, 2Q 2026: seniors housing (independent and assisted living, unit-weighted) units under construction 2.5% of inventory vs. 9.9% at 4Q 2019; occupancy 88.9% vs. 85.9% at 4Q 2019; annual rent growth +4.9%.

12. CoStar, as of 3Q 2026: industrial under construction 1.97% of inventory vs. a 3.53% peak and a 2015–19 average of 1.45%; vacancy 6.9% at 2Q 2026, up from 3.5% in 3Q 2022; net absorption 192 million square feet in 2025, the lowest since 2011; twelve-month asking rent growth +2.7% at 2Q 2026, down from +9.2% in 2022. NCREIF NPI same-property revenue growth, industrial, eight quarters annualized: +3.6% vs. a 2010–19 average of 1.9%.

13. Redfin, rent-versus-buy analysis, data as of December 2025: median monthly mortgage payment $2,675 vs. median asking rent $1,901. National Association of Realtors, 2025 Profile of Home Buyers and Sellers (November 4, 2025): first-time buyer share 21%, the lowest since the series began in 1981; median first-time buyer age 40.

14. U.S. Census Bureau, Vintage 2025 population estimates (June 25, 2026): population 65 and over 64.6 million, 18.9% of the total, up 16% since 2020; population 80 and over 14.7 million.

15. CBRE, North America Data Center Trends H1 2026 (August 27, 2026): primary-market vacancy 1.4%; 7,481 MW under construction, 80.4% pre-leased; net absorption 1,456 MW in the first half of 2026. Green Street, data center sector: effective rents fell every year from 2013 to 2021, a cumulative decline of about 23%, before the current cycle.

16. U.S. Census Bureau, Vintage 2025 (January 27, 2026): net international migration 1.3 million for the year to July 2025, down from 2.7 million in the prior year, with about 321,000 projected for the year to July 2026 if current trends continue. Market groups are based on CoStar data for the 50 largest markets at 2Q 2026: supply-constrained markets with below-median construction and vacancy and rents already rising (for example New York, Chicago, San Francisco, Philadelphia, San Diego); recovery markets where construction has fallen from extreme peaks but remains 3% to 7% of inventory and rents are still falling (for example Austin, Nashville, Charlotte, Phoenix, Denver); and markets with low supply and high vacancy that fit neither (for example Houston, San Antonio, Las Vegas).

17. Mortgage Bankers Association, 2025 Commercial Real Estate Survey of Loan Maturity Volumes (February 9, 2026): $875 billion of commercial and multifamily mortgages maturing in 2026 (17% of $5.0 trillion outstanding), up from $663 billion scheduled for 2026 in the year-earlier survey, after roughly a fifth of 2025’s $957 billion of maturities were extended; $652 billion maturing in 2027. Bloomberg, September 15, 2026: five-year SOFR swap 4.56%, ten-year 4.61%.

18. Federal Reserve, Senior Loan Officer Opinion Survey (FRED series SUBLPDRCSN, SUBLPDRCSM, SUBLPDRCSC), 3Q 2026: net percentage of banks tightening standards on commercial real estate loans −11.3 for nonfarm nonresidential (negative in each of the last three surveys), −5.7 for multifamily, and −3.7 for construction and land development, the first quarter of net easing in all three categories since 2022, after peaks of 64% to 74% net tightening in 2023.

19. NCREIF NPI all-property returns, 1Q 2010–2Q 2022, annualized: income 5.1%, appreciation 5.1%, total 10.4%. Over 1978–2026, income accounts for roughly 80% of total return.

20.Apollo Chief Economist Torsten Sløk, The Daily Spark, ”Since the Fed Started Hiking, Multiple Expansion Has Nearly Vanished as a Source of PE Value” (September 6, 2026) and ”Purchase Price Matters” (September 9, 2026), citing McKinsey vintage data: multiple expansion accounted for about 40% of private equity value creation before the hiking cycle and 8% in 2025.


Did You Miss The Latest?
  • Direct Lending: Strong Fundamentals, Shifting Dynamics
  • After 60/40: What if Traditional Equity Portfolio Diversifiers Are Falling Short?
Share
Download PDF

Related Insights

Important Disclosure Information: This material is for informational purposes only and should not be treated as research or as investment advice. The views and opinions expressed are those of the authors and Apollo Analysts as of the date indicated and are subject to change without notice. There can be no assurance that any trends discussed will continue or that any forecasts will be realized. Statements about conditions that may change the views expressed are subject to risks and uncertainties. Past performance is not indicative of future results. Investing involves risk, including loss of principal. Third-party data are believed to be reliable but have not been independently verified.

This presentation is confidential and may not be distributed, transmitted or otherwise communicated to others, in whole or in part, without the express written consent of Apollo Global Management, Inc. or any of its subsidiaries (”Apollo”; ”we”; or ”our”). Notwithstanding the forgoing, nothing herein is intended to impede an individual from communicating directly with the US Securities and Exchange Commission or other regulatory agency about a possible securities law violation. Apollo has not made any representation or warranty, expressed or implied, with respect to fairness, correctness, accuracy, reasonableness or completeness of any of the information contained herein (including but not limited to information obtained from third parties unrelated to Apollo) and they expressly disclaim any responsibility or liability therefore. The information contained herein is not intended to provide and should not be relied upon for accounting, legal, or tax advice or, investment recommendations. Recipients should make an independent investigation of the opportunity described herein, including consulting their tax, legal, accounting or other advisors. This presentation is for discussion purposes only and represents the views and opinions of Apollo, subject to change at any time without notice. Apollo does not have any responsibility to update the presentation to account for such changes. There can be no assurance that the objectives described herein will be achieved. Nothing herein is intended to imply that the methodology may be considered ”conservative”, ”safe”, ”risk free”, or ”risk averse”. Certain information contained herein may be ”forward-looking” in nature, including statements relating to forecasts, estimates, current and future market conditions and trends that are not historical facts, and are based on current expectations, estimates, projections, opinions and/or beliefs of Apollo. Due to various risks and uncertainties, including known and unknown factors, and assumptions that may have materially changed since such views were formulated, actual events or results may differ materially from those reflected or contemplated in such forward-looking information. There can be no assurance that Apollo’s views described herein will be accurate. As such, undue reliance should not be placed on such information. Forward-looking statements may be identified by the use of terminology including, but not limited to, ”may,” ”will,” ”should,” ”expect,” ”anticipate,” ”target,” ”project,” ”estimate,” ”intend,” ”continue” or ”believe,” or the negatives thereof or other variations thereon or comparable terminology. 

This presentation contains trade names, trademarks and service marks of companies which (i) neither Apollo nor Apollo funds own or (ii) are investments of Apollo or one or more Apollo funds. We do not intend our use or display of these companies’ trade names, trademarks or service marks to imply a relationship with, or endorsement or sponsorship of us by, such companies. Company names and logos are trademarks of their respective holders. No Apollo entity referred to above acts for you and they are not responsible for providing you with the protections afforded to their clients. In particular, they will not provide you with any investment advice. No representative of the Apollo entities is permitted to lead you to believe otherwise. By accepting delivery of this presentation, recipients agree to the disclosure and use restrictions described herein. Recipients may only use this presentation to the extent permitted by the applicable laws and regulations and should be aware of and observe all such applicable laws and regulations. This presentation and the transactions, investments, products, services, securities or other financial instruments referred to in this presentation are not directed to, or intended for distribution to or use by, any person or entity who is a citizen or resident of or located in any locality, state, country or other jurisdiction where such distribution, publication, availability or use would be contrary to any laws or regulations. Distribution of additional information may be restricted in certain jurisdictions. Additional information may be available upon request.