Marc Rowan on how Apollo’s differentiated strategy was built for this moment.
Read More
Private market secondaries have evolved from a niche liquidity tool into an essential component of the private markets ecosystem.
With 2025 volume reaching record highs, secondaries trading still represents only ~2% of overall private market size—pointing to a market with significant room to grow1. Secondary strategies acquire seasoned portfolios, often at a discount, and can offer a distinct combination of attributes, potentially delivering competitive returns in normal markets, smaller losses in downturns, and full participation in recoveries. In our view, this turnkey access to a diversified portfolio makes the asset class an increasingly important complement and potential core portfolio allocation. As the market continues to grow and evolve, however, we believe manager selection and platform capabilities will become increasingly important to navigating a broader and more complex opportunity set.
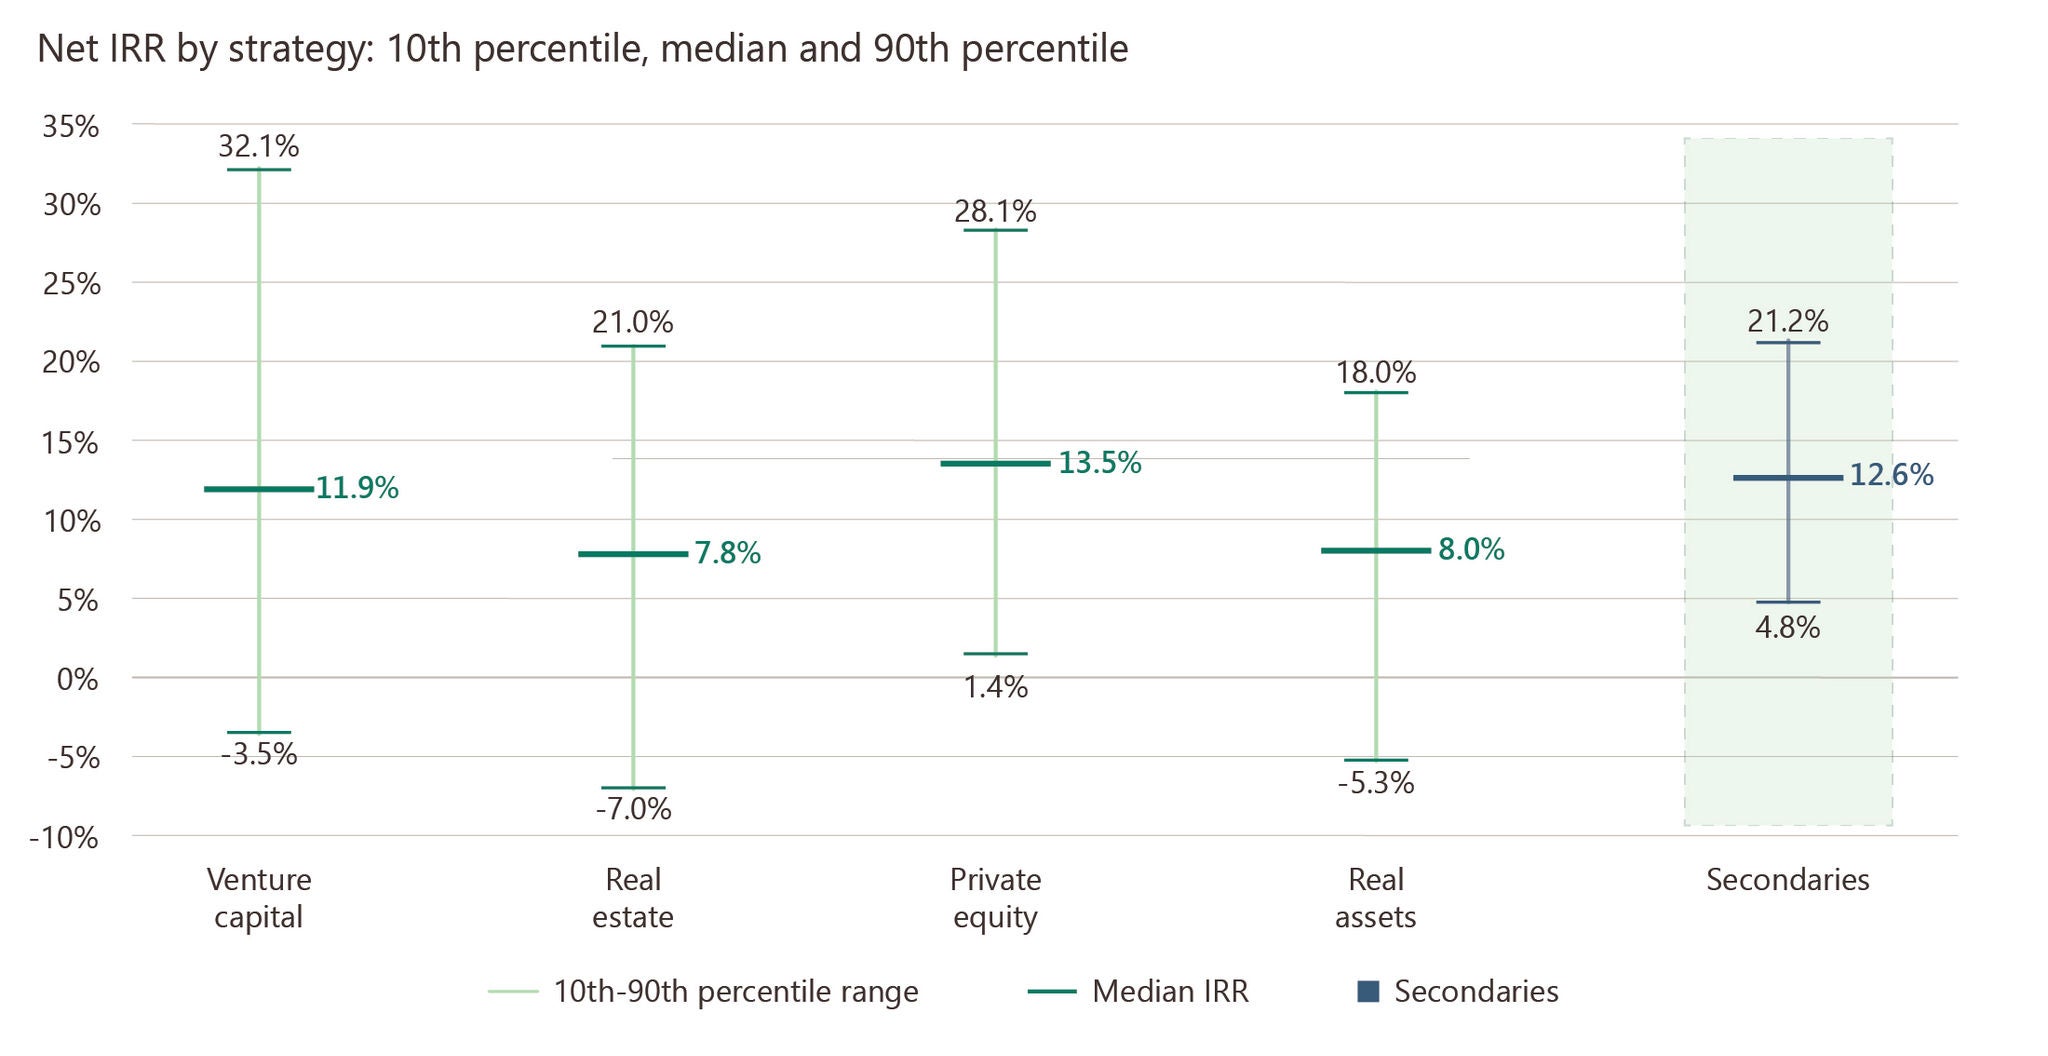
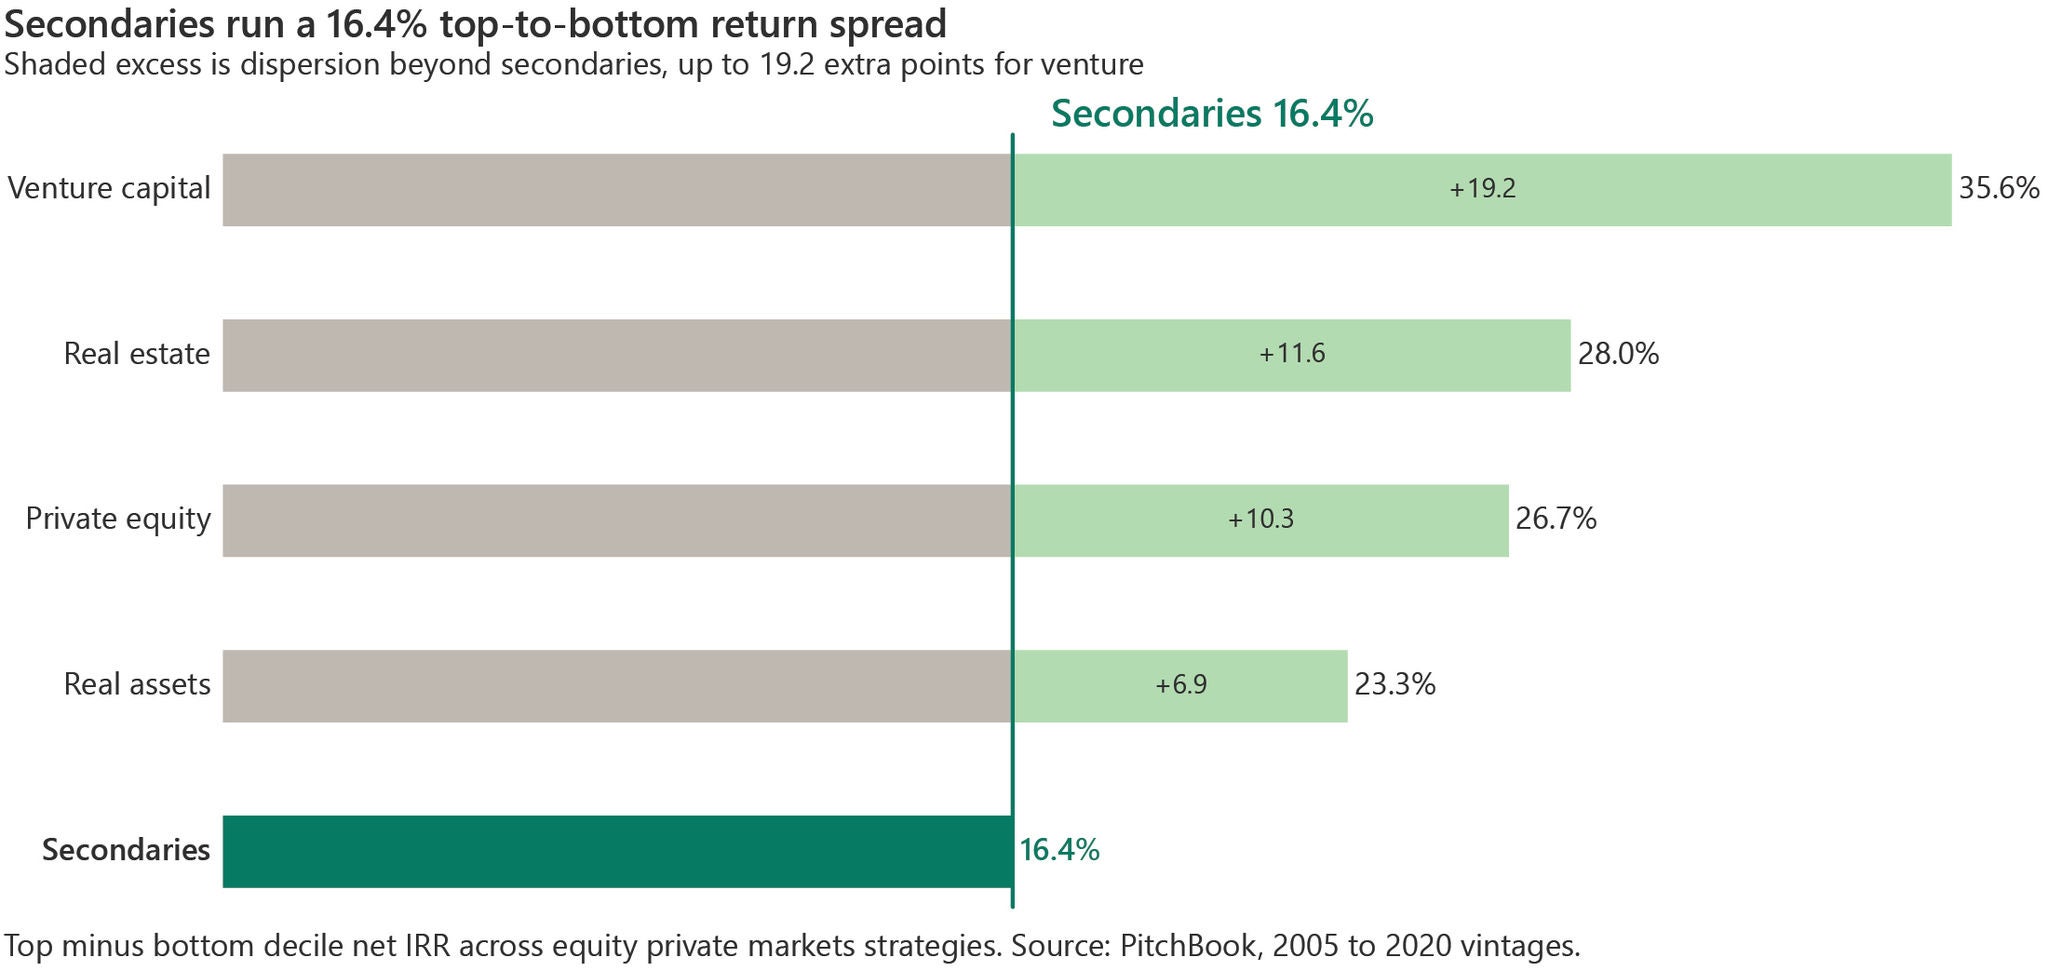
When comparing historical returns across alternatives over a 15-year period, secondaries earned a 12.6% median net IRR with a 16.4-point spread between bottom- and top-decile outcomes, which is a much narrower band of outcomes compared to other strategies.Here’s how to think about what that all means for investors.
Note: Represents top minus bottom decile net IRR across equity private market strategies with 2005 to 2020 vintages. Source: PitchBook Global Fund Performance Report as of Q4 2025 (Vintages 2005-2020). Latest data available. Data is a comparison of private secondary investments and private capital investments sourced from PitchBook’s database. PitchBook data is typically compiled from funds that elect to self-report to Pitchbook and where publicly available. Thus, this data may not be representative of all funds and may be biased toward those funds that generally have higher performance. This performance data reflects the fees, carried interest, and other expenses of the funds included in the data set.
The median return for secondaries outperformed real assets, venture capital and real estate, and delivered nearly the same median return as private equity (12.6% versus 13.5%), but with a range of outcomes that was approximately 39% narrower. At the bottom decile, secondaries still generated a positive 4.8% net IRR, compared with 1.4% for private equity, demonstrating the strong nature of the asset class for the period.
The contrast is even more pronounced relative to higher-risk strategies such as venture capital, which had a 35.6-point spread and a bottom-decile return of negative 3.5%.
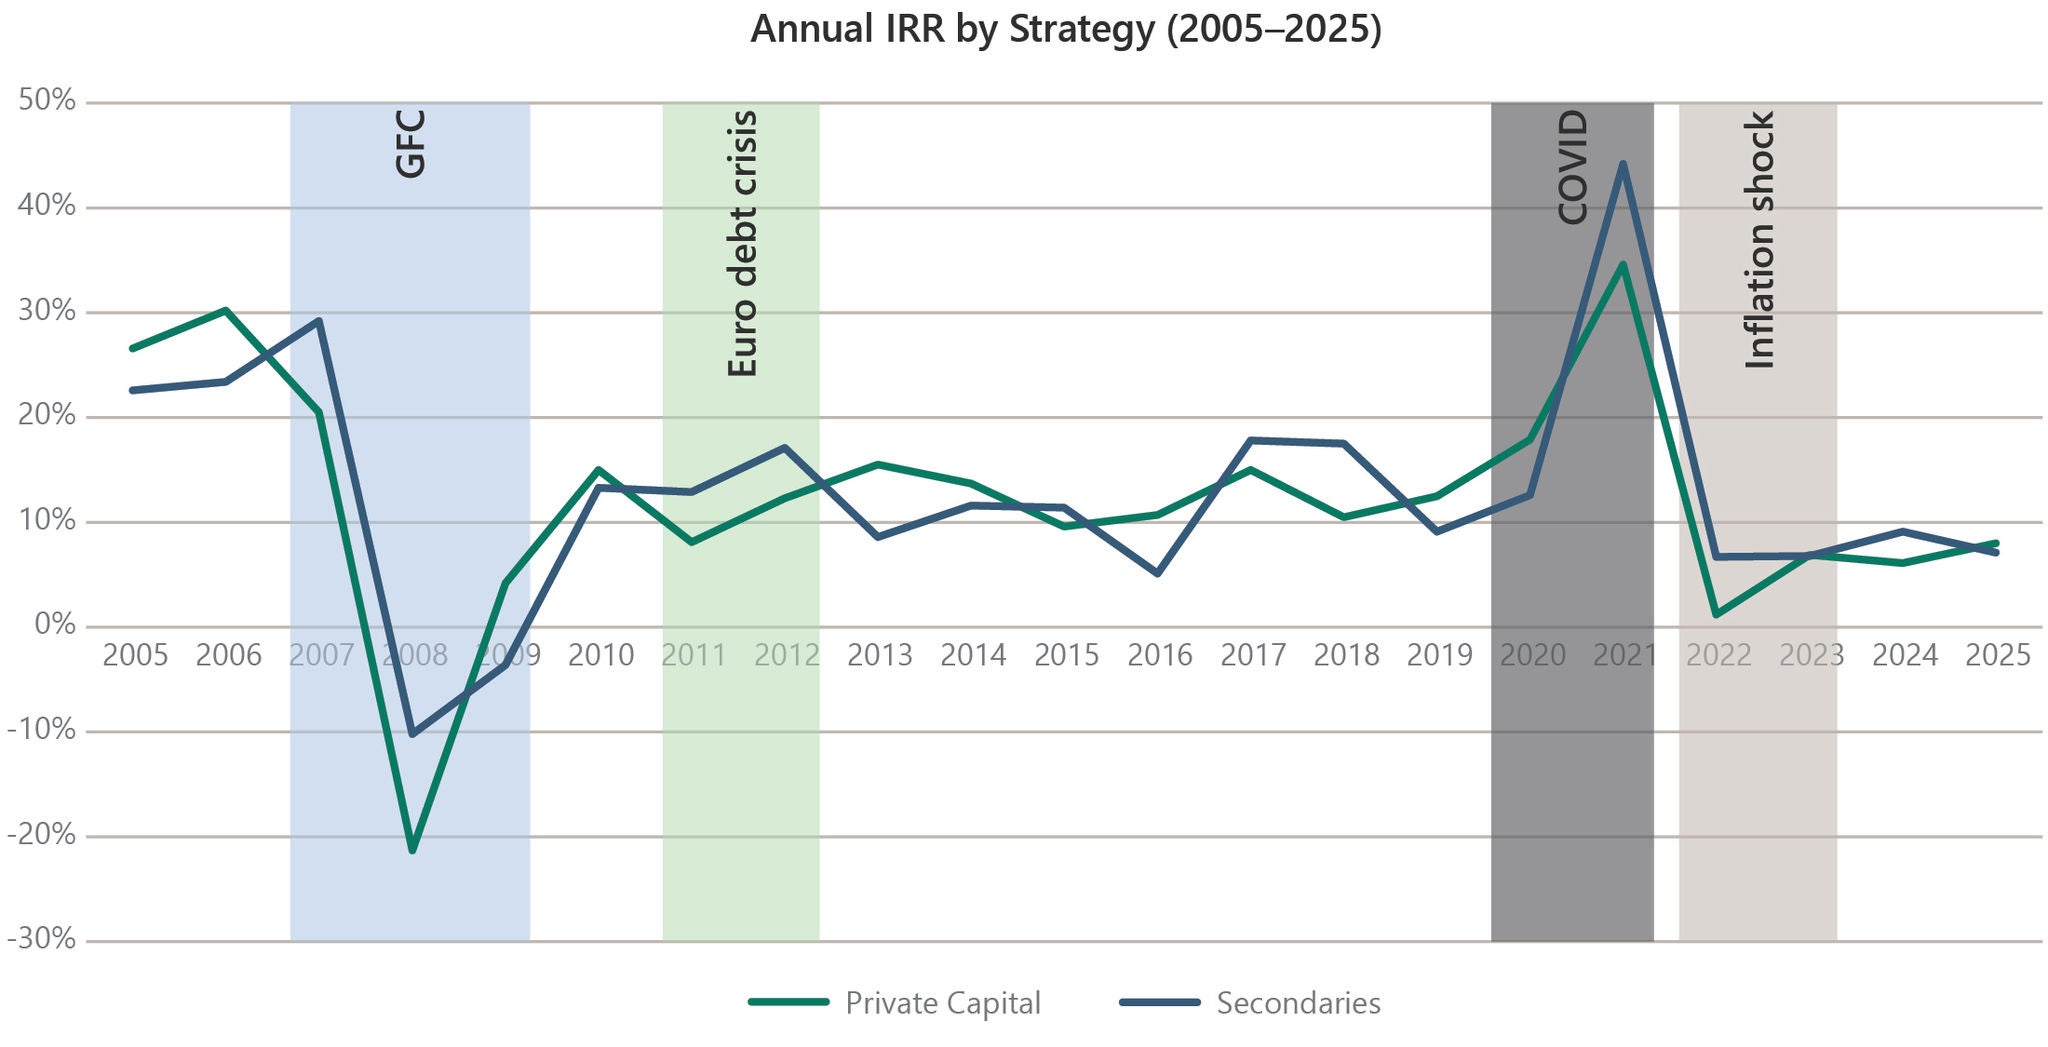
When comparing PitchBook’s full population of active secondaries funds versus all other private capital strategies that the database tracks (private debt, real estate, real assets, venture capital, private equity and fund of funds), secondaries have outperformed many private capital strategies through every major shock of the past two decades. For example, in the Global Financial Crisis secondaries fell about half as much, roughly negative 10% against negative 20% for the full private capital universe, and stayed positive through the inflation shock, earning about 7% in 2022 against roughly 1.5% for private capital. They also captured the upside, leading the rebound with 44% in 2021 against 34% for private capital broadly. By buying seasoned portfolios at discounts when other investors need liquidity, secondary strategies can turn market stress into attractive entry points.
This strength of secondaries is broad-based. The past two decades saw four market shocks with four different causes: a credit crisis, a sovereign debt crisis, a pandemic, and an inflation spike. Secondaries have demonstrated relative outperformance in each instance.
Secondaries’ Long Track Record Across Market Cycles
Source: PitchBook; based on calendar-year returns through year end 2025. The Secondaries dataset covers PitchBook’s full population of active secondaries funds and includes both newer and more mature funds; the Private Capital data set is private capital investments sourced from PitchBook’s database.
Because secondaries invest in funds that are already well into their lifecycle, capital can be deployed more quickly, distributions begin sooner, and the J-curve effect is significantly reduced. Exposure can be diversified across managers, vintages, sectors, and hundreds of underlying companies, potentially reducing concentration risk. At the same time, investors acquire portfolios with established assets rather than committing to blind pools, which may provide greater transparency into the underlying investments.
Market shocks can have less impact on assets that are closer to exit than entry. As a result, valuations and cash flows may be less sensitive than those of newly raised primary funds deployed at market peaks. During periods of dislocation, the opportunity set often expands as liquidity needs drive attractive secondary transactions. Investors with flexible capital can acquire LP interests at discounts or provide liquidity through GP-led continuation vehicles, turning periods of market stress into potential opportunities to deploy capital on favorable terms.
Taken together, these characteristics are what make secondaries a differentiated strategy, and one that we believe will continue to perform well through cycles and generate attractive risk-adjusted returns.
Investors considering secondary allocations in today’s market have important dynamics to consider. Through 2020, the secondary market opportunity set was largely LP-led, i.e., institutional investors selling fund stakes to rebalance portfolios or raise liquidity. Since 2021, however, GP-led deals, particularly single-asset continuation vehicles, have become a meaningful share of supply. That shift expands the opportunity set and, we believe, has the potential to lift median returns. But it also introduces more dispersion as GP-led transactions tend to be more concentrated investments with greater return potential.
The structural advantages that have made the asset class strong across cycles remain firmly intact. What's changed is that the asset class has become more dynamic, as the secondary market reached $226 billion of annual volume in 2025, a record high and a 41% year-over-year increase.1
This dynamic and expanding landscape requires a manager and investment platform with the sourcing relationships, analytical breadth and depth, unique portfolio perspectives and industry and company-level insights, and structuring capability to navigate a more complex market.
As part of Apollo’s broader investment platform, S3 can also draw on perspectives and insights across strategies, industries and individual companies to inform underwriting and identify opportunities across the secondary market.
For investors, that's ultimately good news. A larger, more sophisticated opportunity set in the hands of the right manager can mean more ways to put capital to work at attractive terms, in any market environment.
Foot Notes:
1. Source: Evercore 2025 Secondary Market Highlights (January 2026).
Tags
Tags
All information contained in this material is as of October 2026 unless otherwise indicated.
This material is for informational purposes only and should not be treated as research. This material should not be copied, distributed, published, or reproduced, in whole or in part, or disclosed by any recipient to any other person without the express written consent of Apollo Global Management, Inc. (together with its subsidiaries, “Apollo”).
The views and opinions expressed in this material are the views and opinions of Apollo Analysts. They may not reflect the views and opinions of Apollo and are subject to change at any time without notice. Further, Apollo and its affiliates may have positions (long or short) or engage in securities transactions that are not consistent with the information and views expressed in this material. There can be no assurance that an investment strategy will be successful. Target allocations contained in this material are subject to change. There is no assurance that the target allocations will be achieved, and actual allocations may be significantly different than that shown here. This material does not constitute an offer of any service or product of Apollo. It is not an invitation by or on behalf of Apollo to any person to buy or sell any security or to adopt any investment strategy, and shall not form the basis of, nor may it accompany nor form part of, any right or contract to buy or sell any security or to adopt any investment strategy. Nothing in this material should be taken as investment advice or a recommendation to enter into any transaction.
Hyperlinks to third-party websites in this material are provided for reader convenience only. There can be no assurances that any of the trends described in this material will continue or will not reverse. Past events and trends do not imply, predict or guarantee, and are not necessarily indicative of future events or results. Unless otherwise noted, information included in this material is presented as of the dates indicated. This material is not complete and the information contained in this material may change at any time without notice. Apollo has not made any representation or warranty, expressed or implied, with respect to fairness, correctness, accuracy, reasonableness, or completeness of any of the information contained in this material (including but not limited to information obtained from third parties unrelated to Apollo), and expressly disclaims any responsibility or liability thereof. The information contained in this material is not intended to provide, and should not be relied upon for, accounting, legal or tax advice or investment recommendations. Investors should make an independent investigation of the information contained in this material, including consulting their tax, legal, accounting or other advisors about such information. Apollo does not act for you and is not responsible for providing you with the protections afforded to its clients.
Certain information contained in this material may be “forward-looking” in nature. Due to various risks and uncertainties, actual events or results may differ materially from those reflected or contemplated in such forward-looking information. As such, undue reliance should not be placed on such information. Forward-looking statements may be identified by the use of terminology including, but not limited to, “may”, “will”, “should”, “expect”, “anticipate”, “target”, “project”, “estimate”, “intend”, “continue” or “believe” or the negatives thereof or other variations thereon or comparable terminology.
Investing involves risk including loss of principal. Alternative investments often are speculative, typically have higher fees than traditional investments often include a high degree of risk and are appropriate only for eligible long-term investors who are willing to forgo liquidity and put capital at risk for an indefinite period of time. They may be highly illiquid and can engage in leverage and other speculative practices that may increase volatility and risk of loss. References to downside protection are not guarantees against loss of investment capital or value. This material may contain trade names, trademarks and service marks of companies which (i) neither Apollo nor Apollo funds own or (ii) are investments of Apollo or one or more Apollo funds. We do not intend our use or display of these companies’ trade names, trademarks or service marks to imply a relationship with, or endorsement or sponsorship of us by, such companies. Company names and logos are trademarks of their respective holders.
Past performance is not necessarily indicative of future results.
Additional information may be available upon request. © 2026 Apollo Global Management, Inc. All Rights Reserved.