Illustration of a glowing light bulb with a stylized capital “A” filament centered inside, symbolizing ideas, innovation, and insight against a green circular background.

The Daily Spark

Stay ahead of the markets with The Daily Spark at Apollo. Get exclusive, daily data-driven analysis on the US economy, inflation, and capital markets from Apollo Chief Economist Torsten Slok.
Subscribe About the Author

Not subscribed yet? Get the Daily Spark delivered to your inbox.

Subscribe
Filters
Topics
1-10 of 677 Results
Global & Geopolitical Developments

November 10, 2026

Utilities, Defense and Digitization are Driving Europe’s Capex Revival

Share

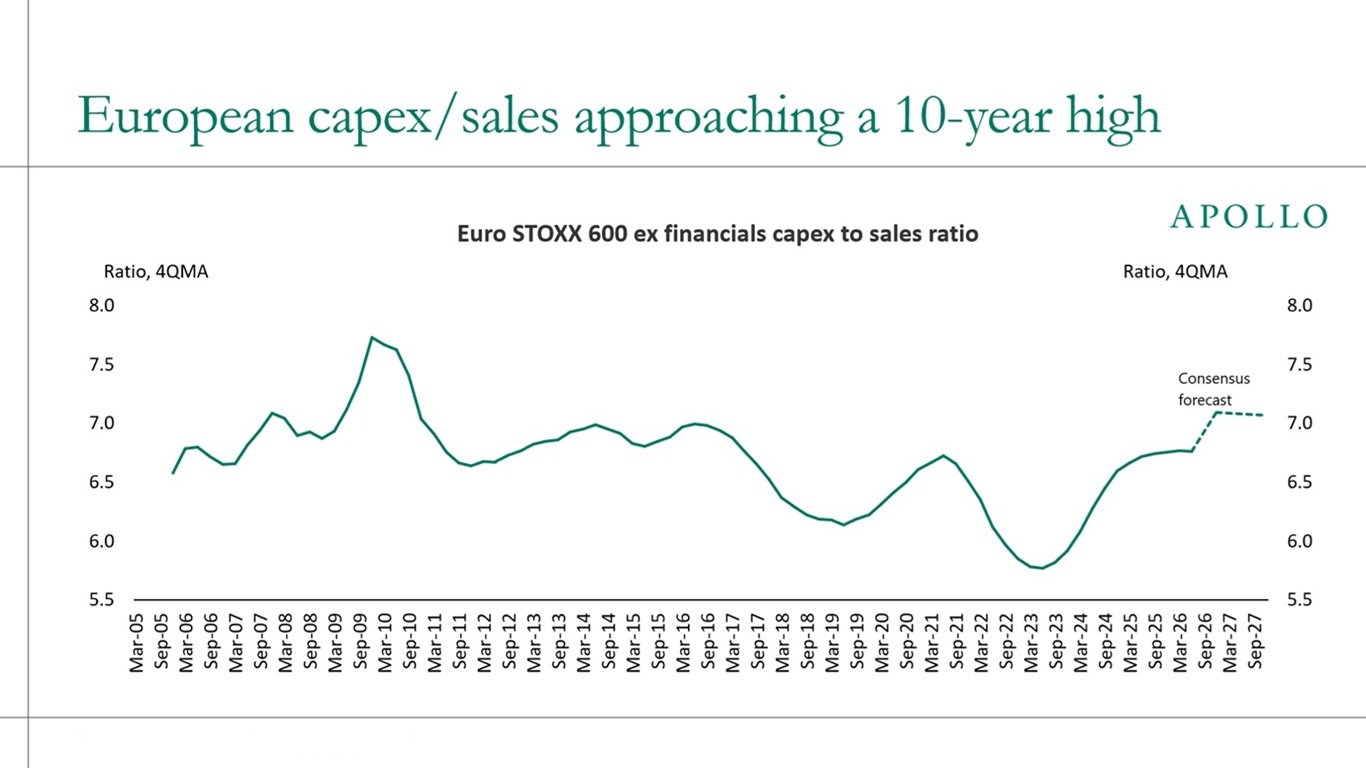
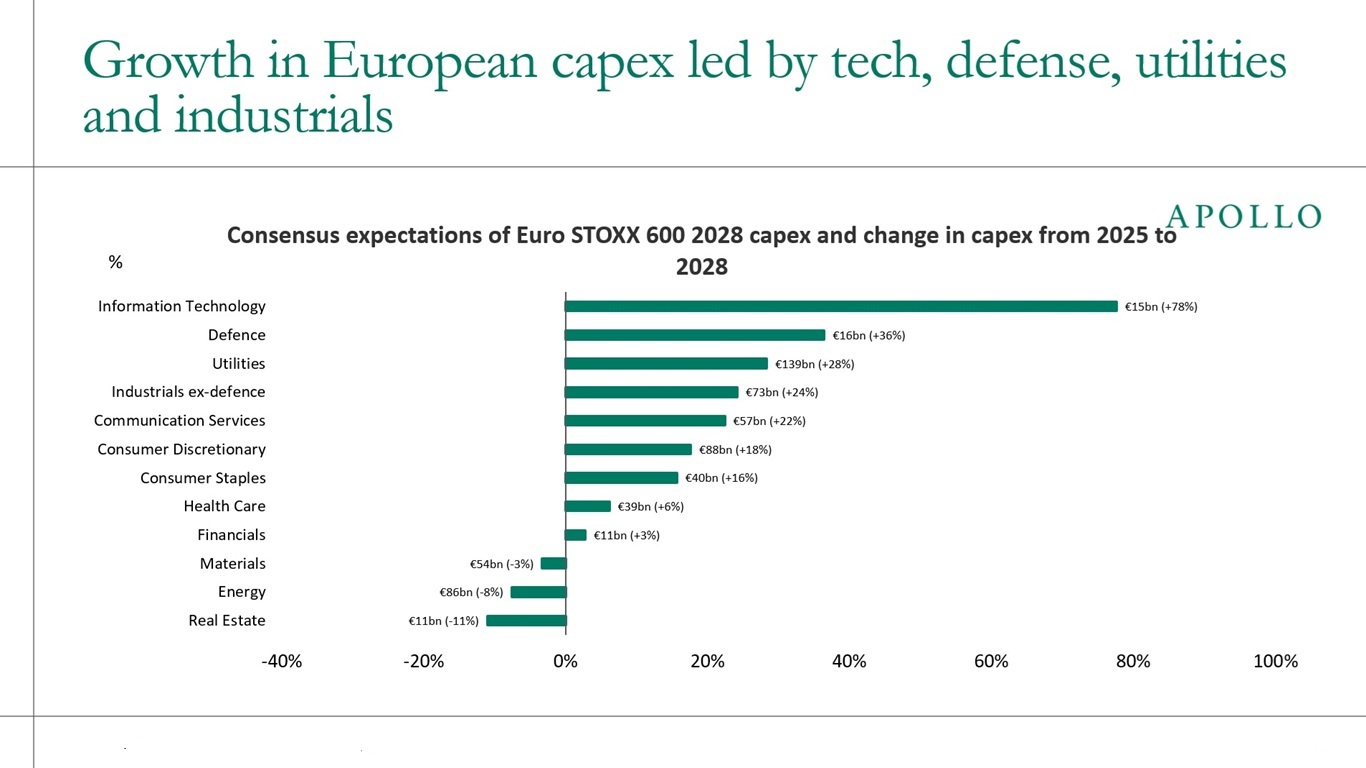
European companies are investing again. The capex-to-sales ratio is approaching a 10-year high, and European listed companies are expected to spend €77 billion more on capex in 2028 than in 2025, see charts below.

Utilities alone account for €31 billion, or around 40%, of the increase. Defense capex is expected to rise 36%, industrials excluding defense 24% and information technology 78%.

This comes after a long period of underinvestment. Across Europe, higher spending on energy, grids, defense, reshoring, infrastructure and digitalization is now lifting capital intensity.

The US capex cycle is dominated by AI. Europe's has a different mix: more of the increase is being driven by infrastructure, defense and power.

The bottom line is that capex is rebounding across Europe, and the industrial renaissance has gone global.

Written by Huw van Steenis

Download high-res charts

See important disclaimers at the bottom of the page.

Financial Markets & Risk Dynamics

November 09, 2026

Price Discovery Is Still Broken

Share

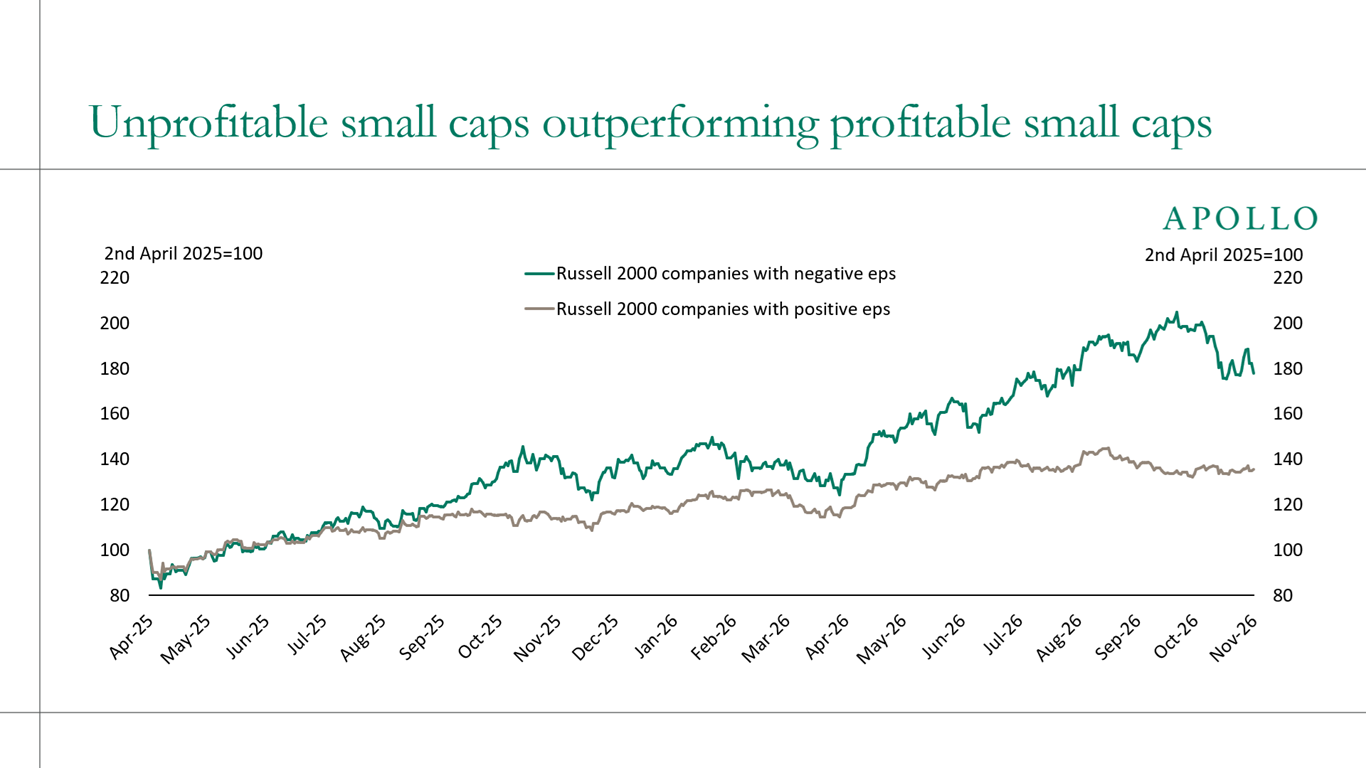
Something is broken in price discovery when companies with negative earnings keep outperforming companies with positive earnings, see chart below.

Download high-res chart

See important disclaimers at the bottom of the page.

Global & Geopolitical Developments

November 08, 2026

NATO’s Defense Buildout Is a Private Capital Opportunity

Share

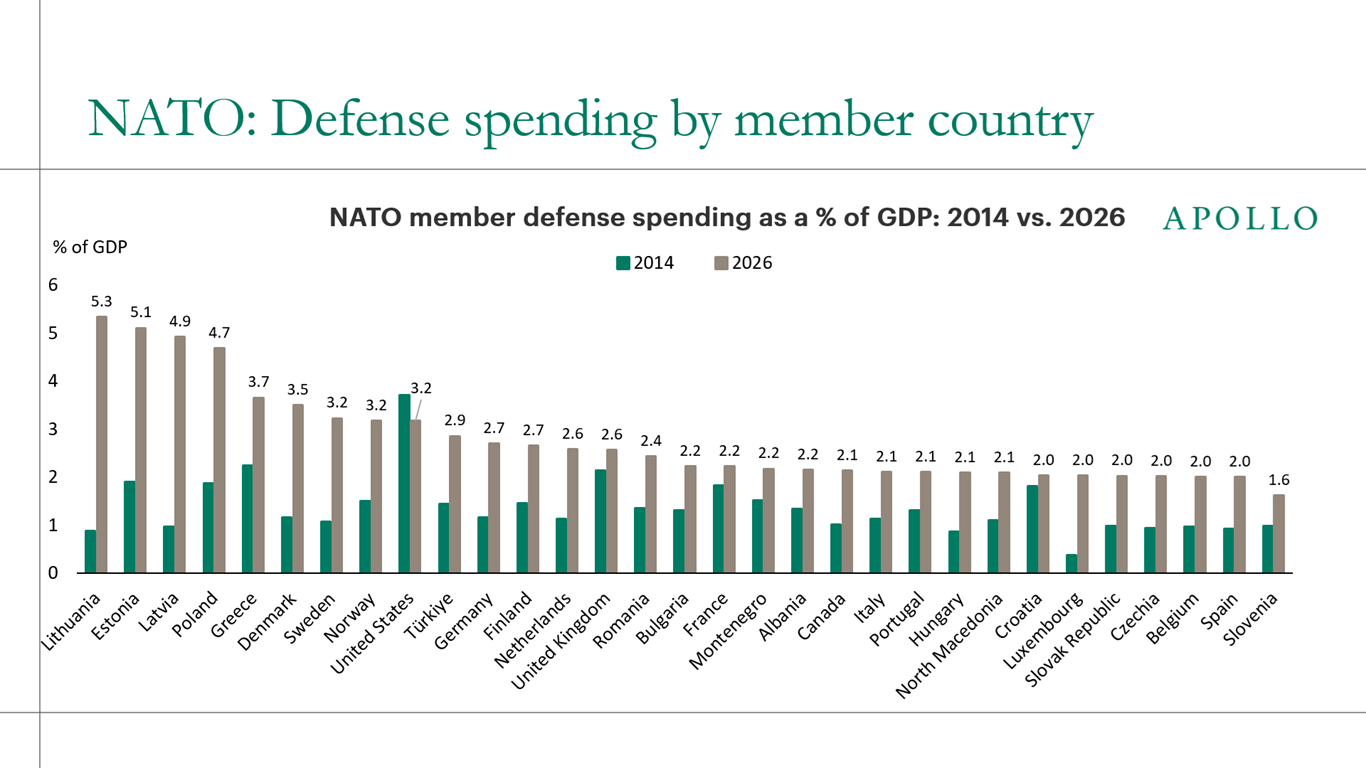
Since 2014, NATO members have sharply raised defense spending. Financing that buildout through private capital in areas like infrastructure, supply chains and dual-use technology is a growing opportunity for investors, in particular in Europe.

Download high-res chart

See important disclaimers at the bottom of the page.

Financial Markets & Risk Dynamics

November 07, 2026

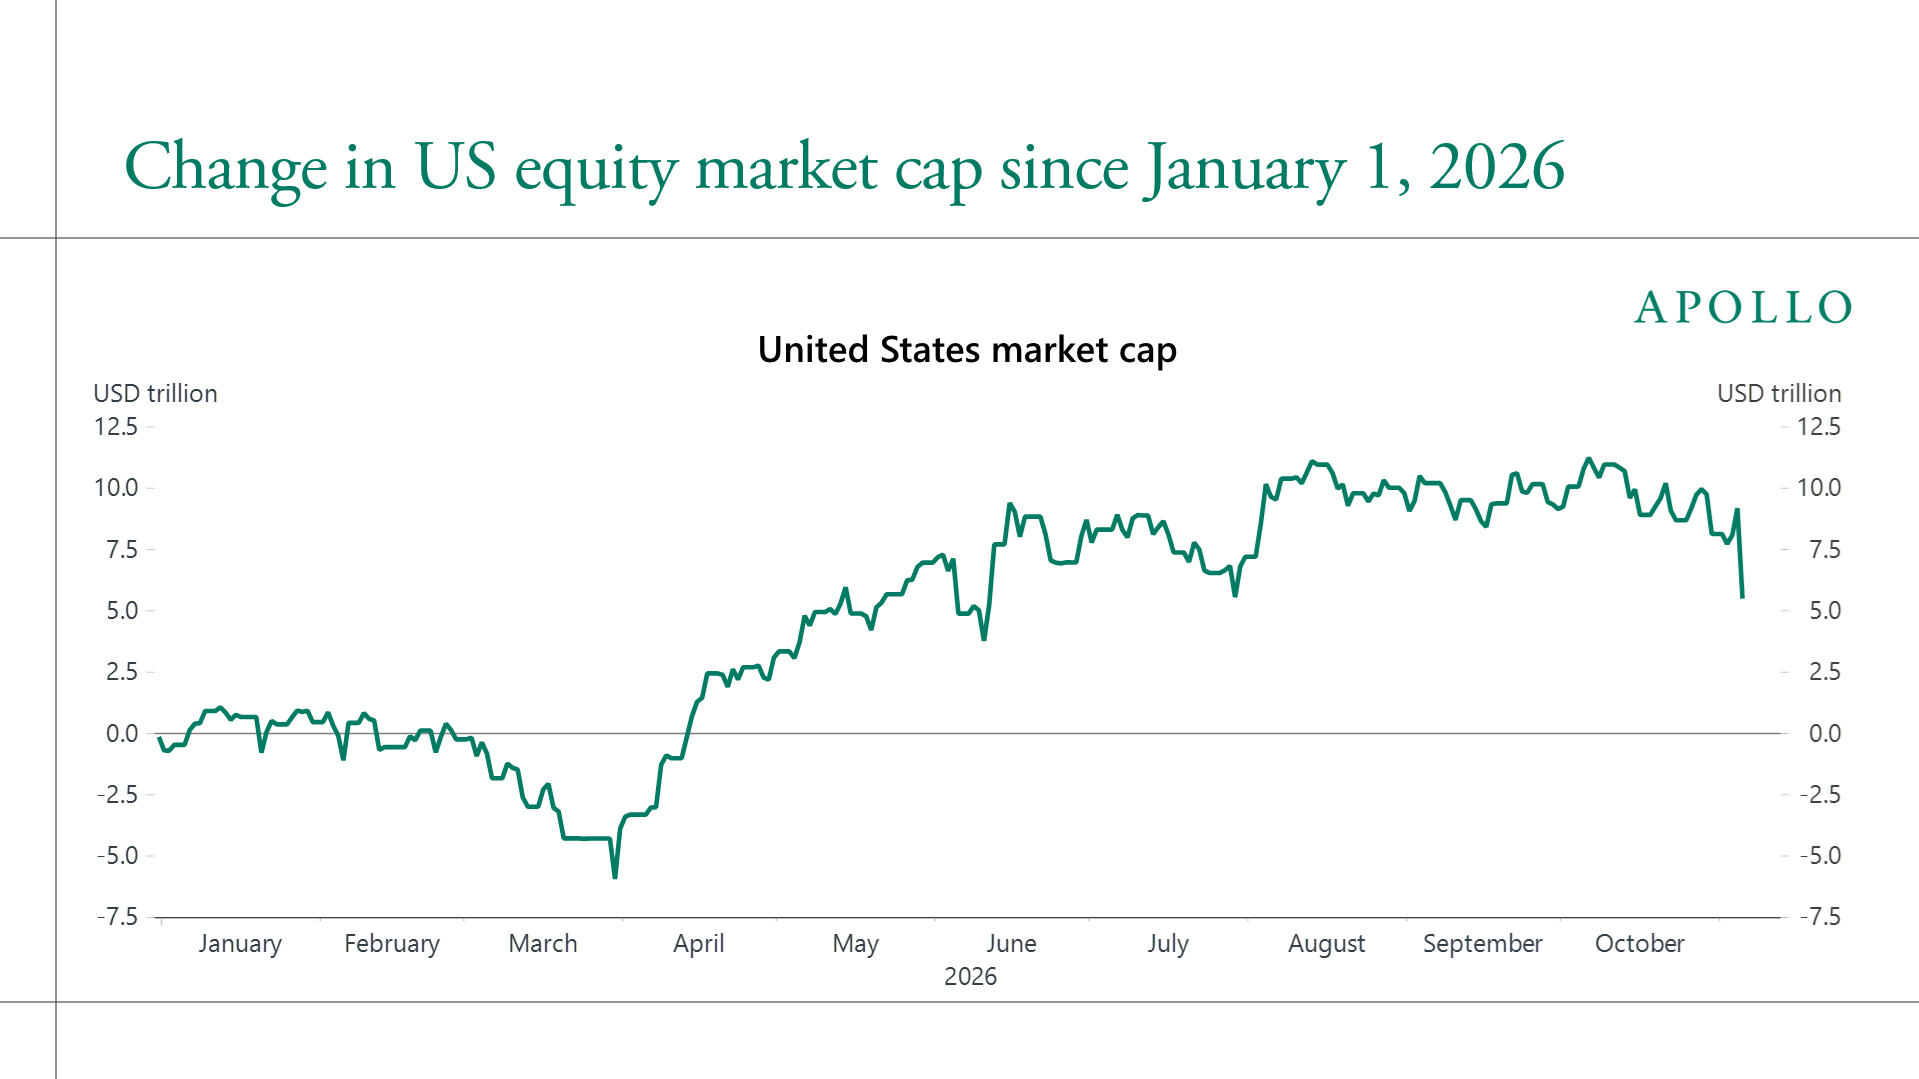
Equity Selloff Trims US Market Cap Gain to $5 Trillion YTD

Share

Despite the turbulence this week, the total market cap of the US stock market is still up $5 trillion since the beginning of the year, see chart below.

Download high-res chart

See important disclaimers at the bottom of the page.

Macroeconomic Indicators & Trends

November 06, 2026

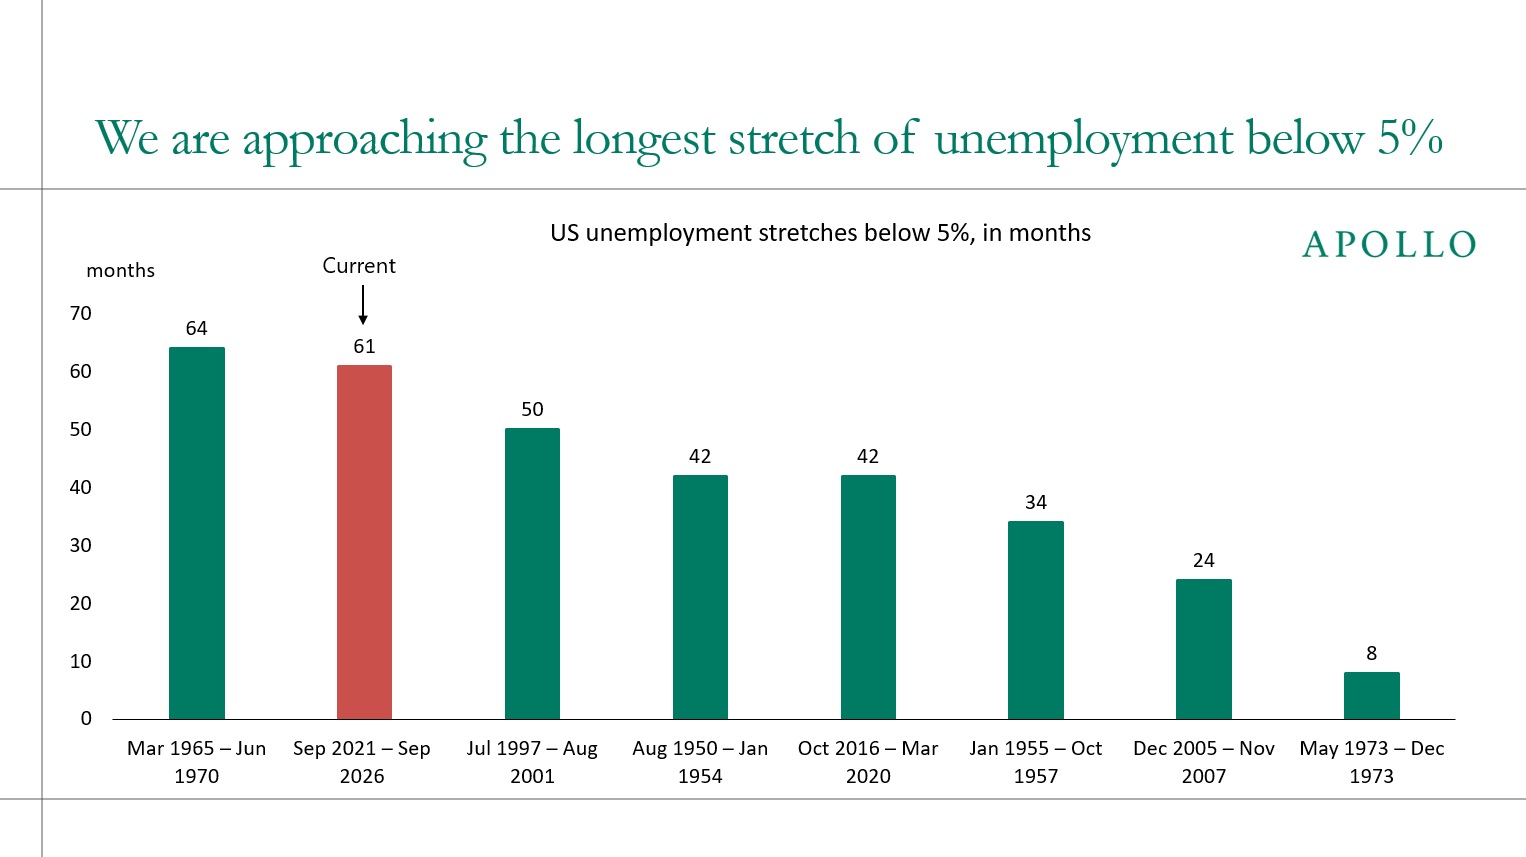
The Low Unemployment Streak Nears a Record

Share

Through September 2026, the US labor market had kept unemployment below 5% for 61 straight months (since September 2021), putting it just three months shy of the record 64-month stretch set from 1965 to 1970, see chart below.

The bottom line is that the current expansion is on the verge of becoming the longest period of sustained labor market strength in modern US history, outlasting the late-1990s boom and every other run on record except one.

Download high-res chart

See important disclaimers at the bottom of the page.

Financial Markets & Risk Dynamics

November 05, 2026

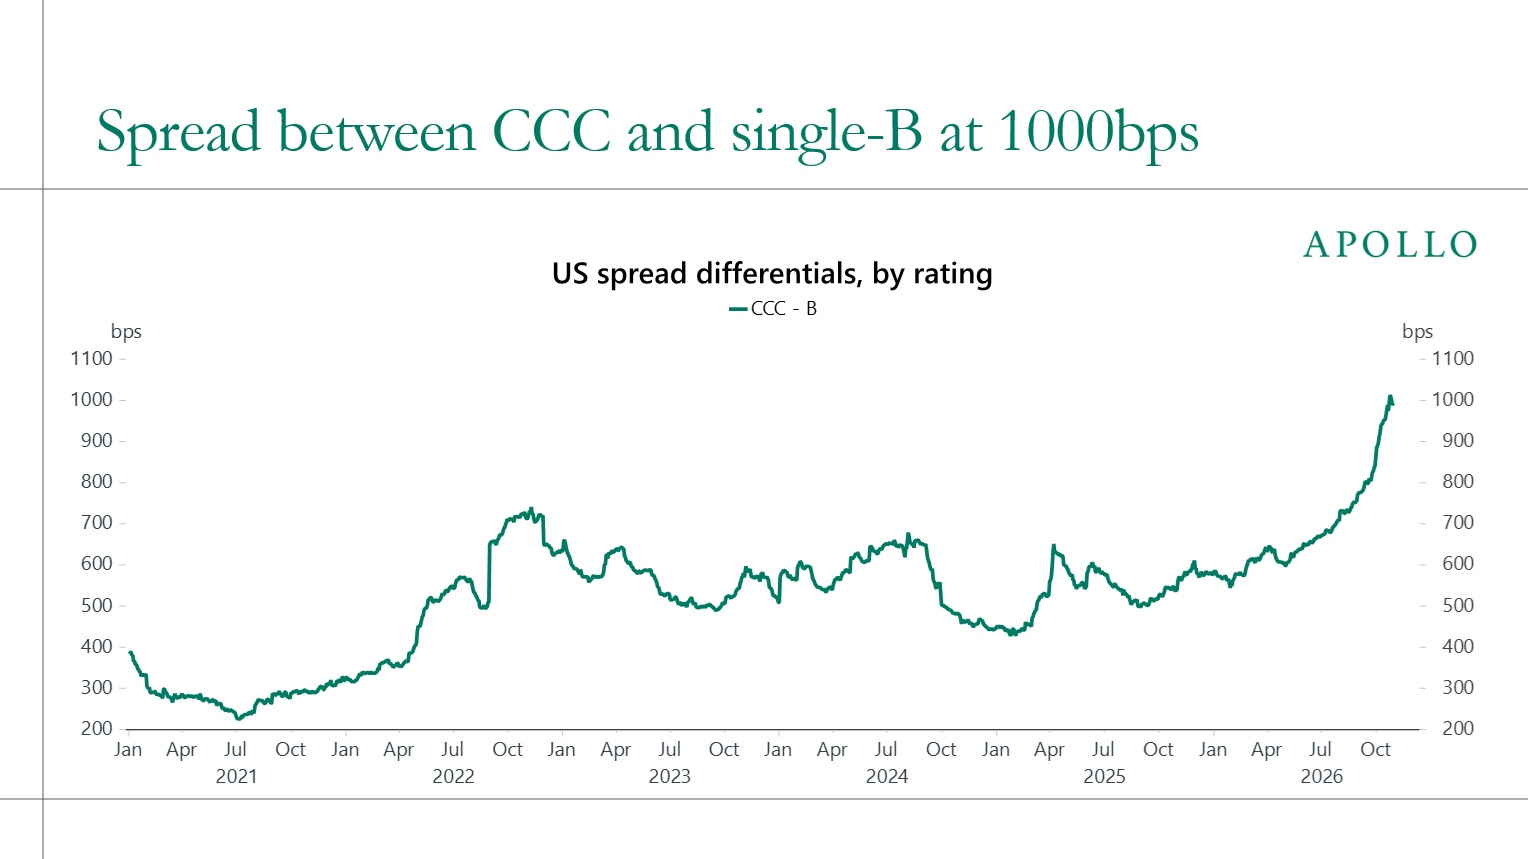
Is the CCC Stress Spreading to Single-B?

Share

When rates are higher for longer, stress in credit markets starts migrating from the bottom, beginning with the lowest-rated credit.

The ongoing widening between CCC and single-B shows that the weakest borrowers have run out of runway, and three things would need to happen for stress to migrate to single-B:

  1. Time. Single-B issuers have more cushion, but the cushion is finite. If rates stay at current levels, coverage ratios keep eroding as cheap debt reprices at maturity. Higher-for-longer is a slow leak for B, not a cliff, so the lag between CCC and B can be long.
  2. Access to capital. What keeps B stable is that the refinancing window is open. If it closes, through a risk-off shock or banks and private lenders pulling back, B issuers lose the ability to roll, and stress spreads quickly.
  3. Contagion through technicals. Rising CCC defaults can force CLO managers to hit CCC buckets, which constrains demand for B loans and pushes the two ratings together even without any change in B fundamentals.

The bottom line is that a single-B issuer typically has thin but positive free cash flow after interest. A CCC issuer often does not, so every quarter of elevated rates means more cash burn, a bigger PIK component and a growing reliance on refinancing windows or liability management exercises.

Download high-res chart

See important disclaimers at the bottom of the page.

Global & Geopolitical Developments

November 04, 2026

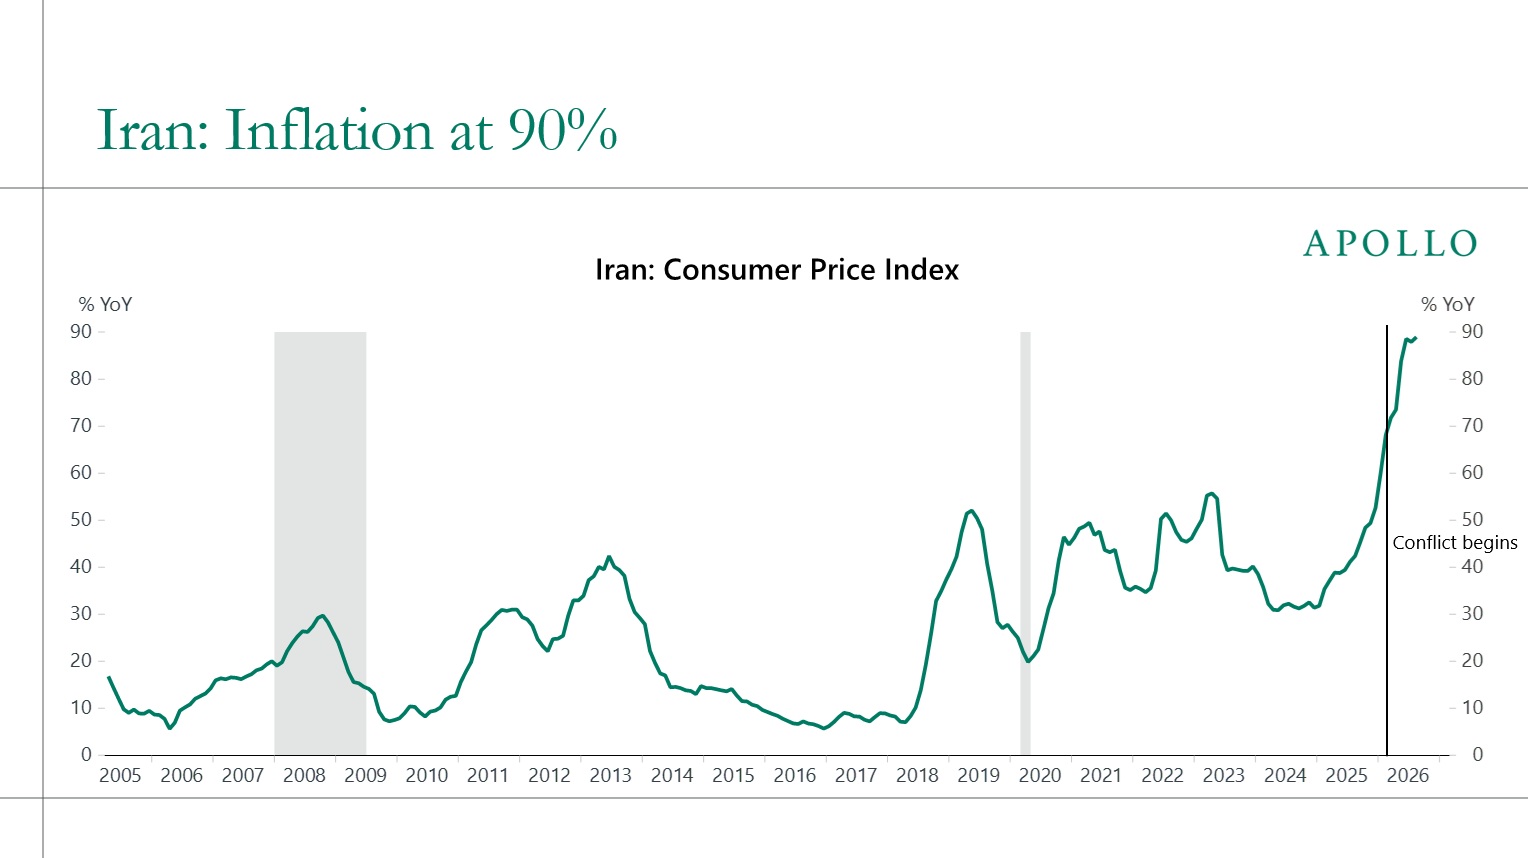
Iran: Severe Stress Now, More Risk If Conflict Returns

Share

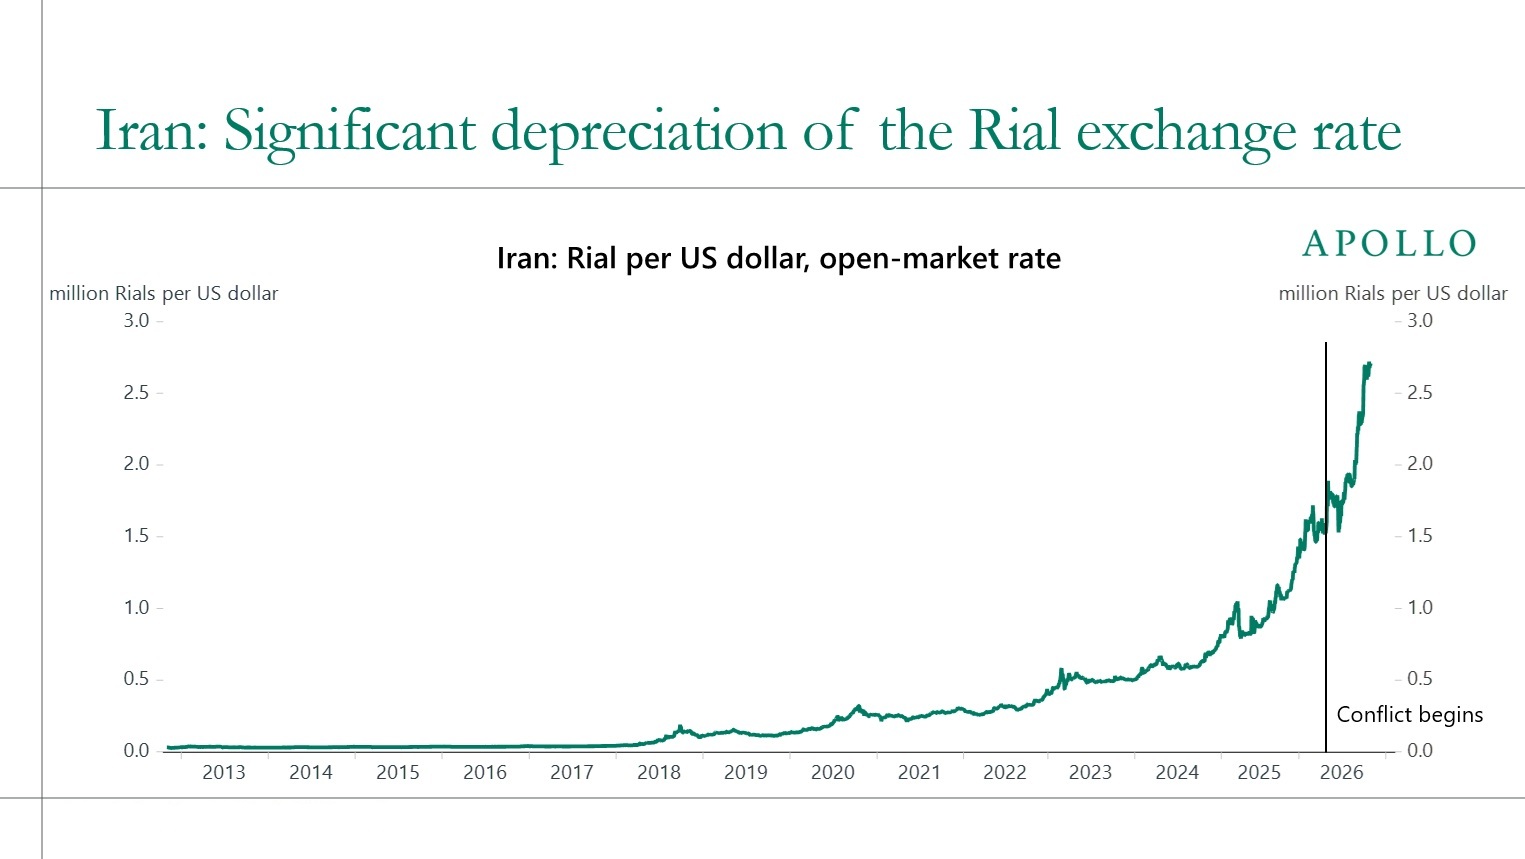
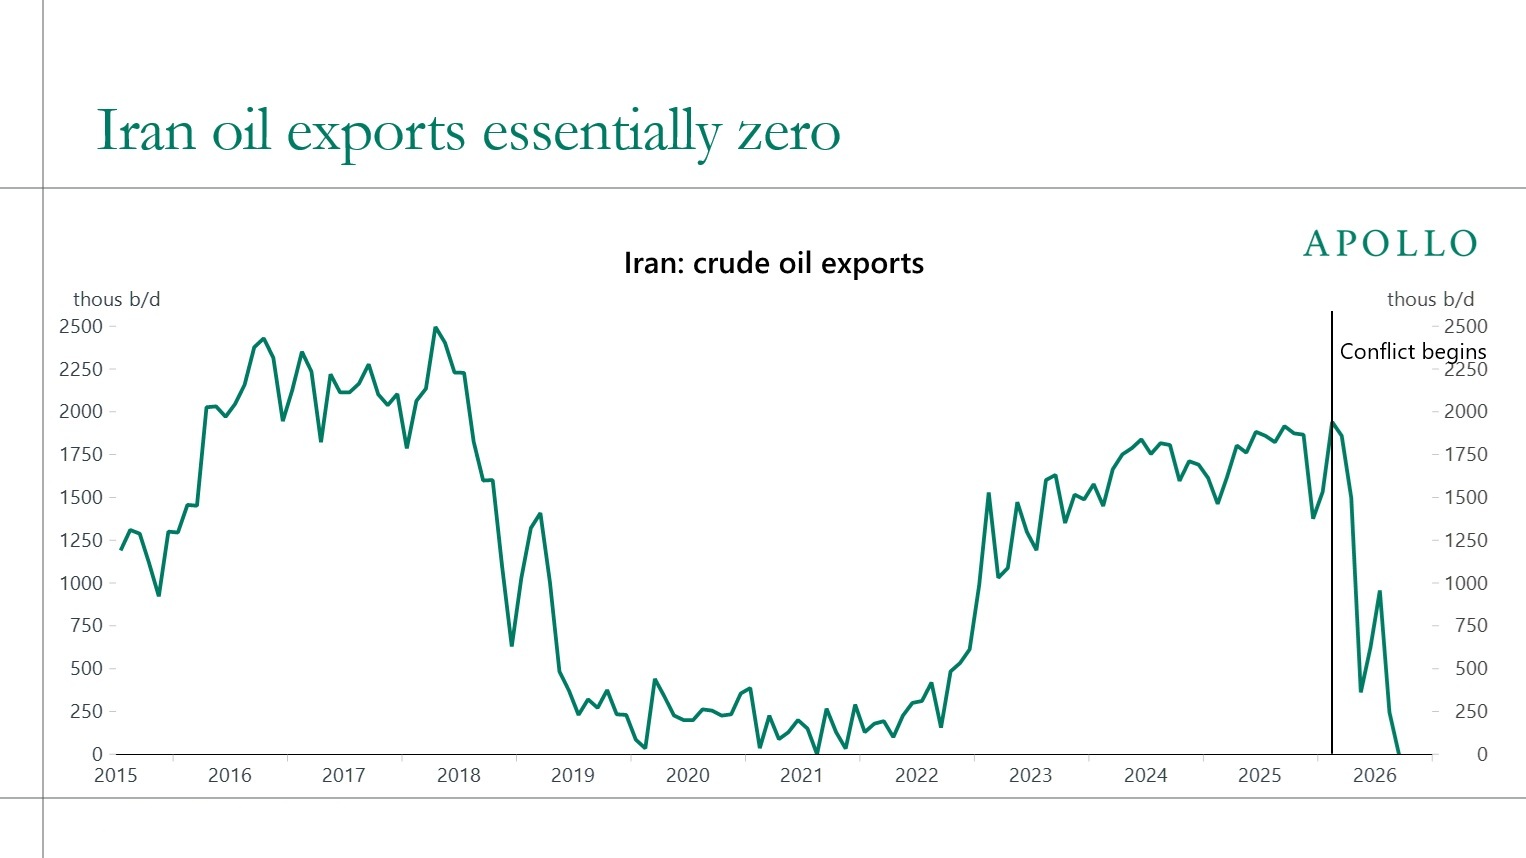
Since the conflict began, Iran has seen inflation near 90%, a collapsing currency and oil exports falling to essentially zero.

Inflation is at 90%. Iranian consumer price inflation has surged to roughly 90% YoY, well above the previous peaks of around 50% seen in 2019-20 and 2022. Inflation had already been climbing before the conflict, but the pace of acceleration has increased sharply since it began.

The rial exchange rate is in free fall. On the open market, the rial has weakened to nearly 3 million per US dollar. The currency spent most of the last decade trending gradually lower, but the move has turned near-vertical since the conflict began. A weaker rial raises the cost of imports, which feeds directly into the inflation seen in the first chart.

Oil exports have collapsed. Crude exports, Iran’s main source of foreign currency, have fallen from roughly 1.8 million barrels per day to essentially zero. Iran has been through a similar episode before when exports dropped from over 2.5 million b/d in 2018 to very low levels through 2019-21 under sanctions, and only recovered gradually afterward. This time the fall is steeper and faster.

The bottom line is that the three charts are connected. Lost oil revenue means fewer dollars flowing into the country, which pushes the rial lower, which in turn drives import prices and inflation higher. Together, these charts point to severe stress on Iran’s economy, and this negative feedback loop continues for as long as exports remain shut in.

Download high-res charts

See important disclaimers at the bottom of the page.

Macroeconomic Indicators & Trends

November 03, 2026

10% Nominal GDP Growth Coming?

Share

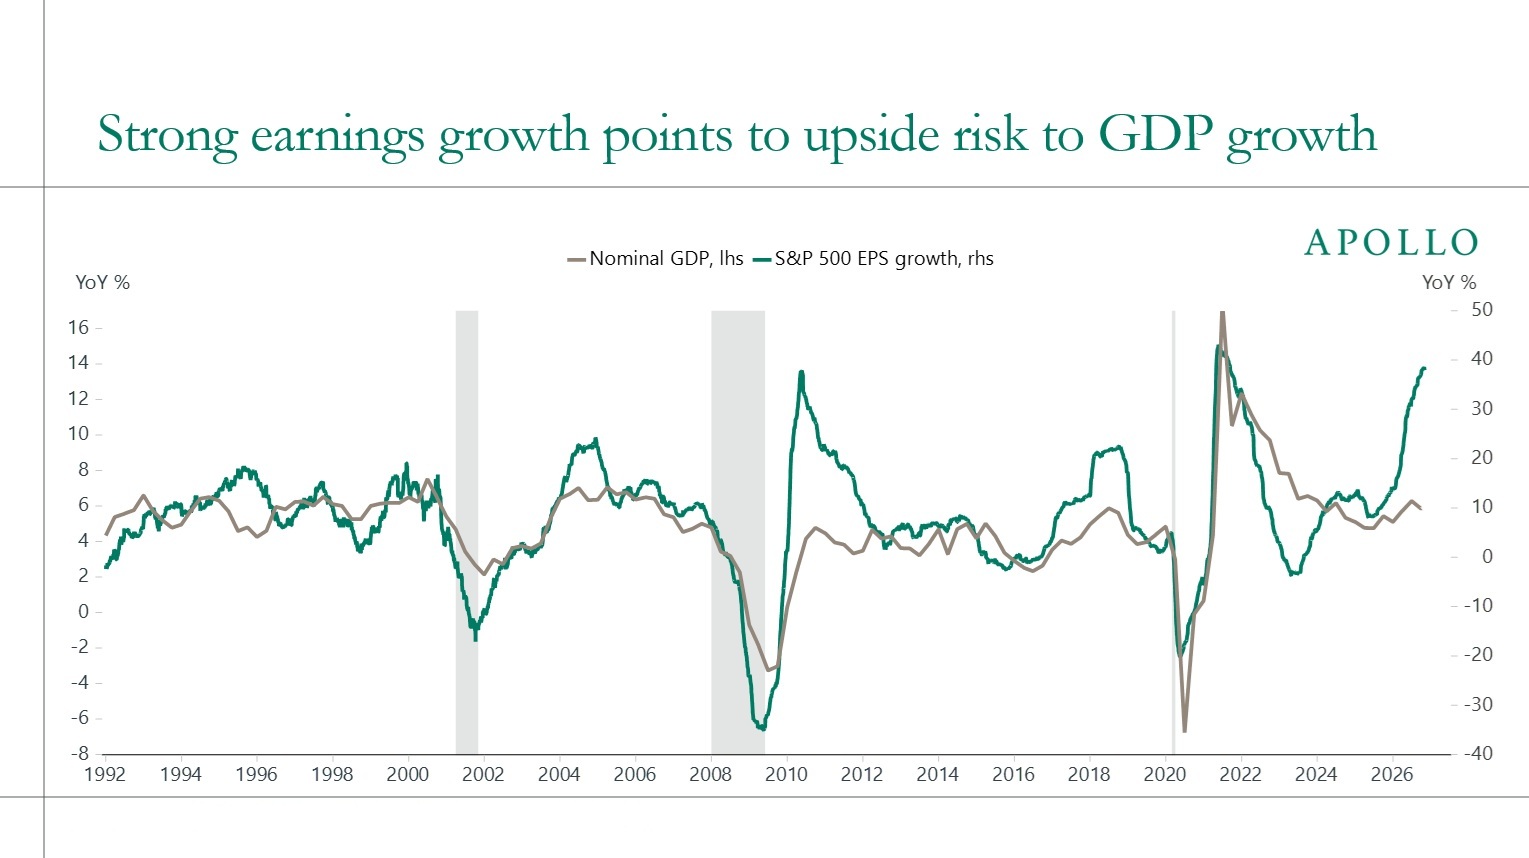
Nominal GDP growth is currently solid at around 6%, while S&P 500 earnings growth has surged to nearly 40% YoY. A simple regression based on the historical relationship between the two suggests that the current pace of earnings growth is consistent with nominal GDP growth of 10%, see chart below.

The strong increase in corporate earnings and the resulting upside risk to GDP growth also point to upside risk to Friday’s employment report.

With strong earnings and upside risks to GDP growth and employment, the implication for investors is that interest rates will stay higher for longer, particularly when combined with the ongoing fiscal challenges.

Download high-res chart

See important disclaimers at the bottom of the page.

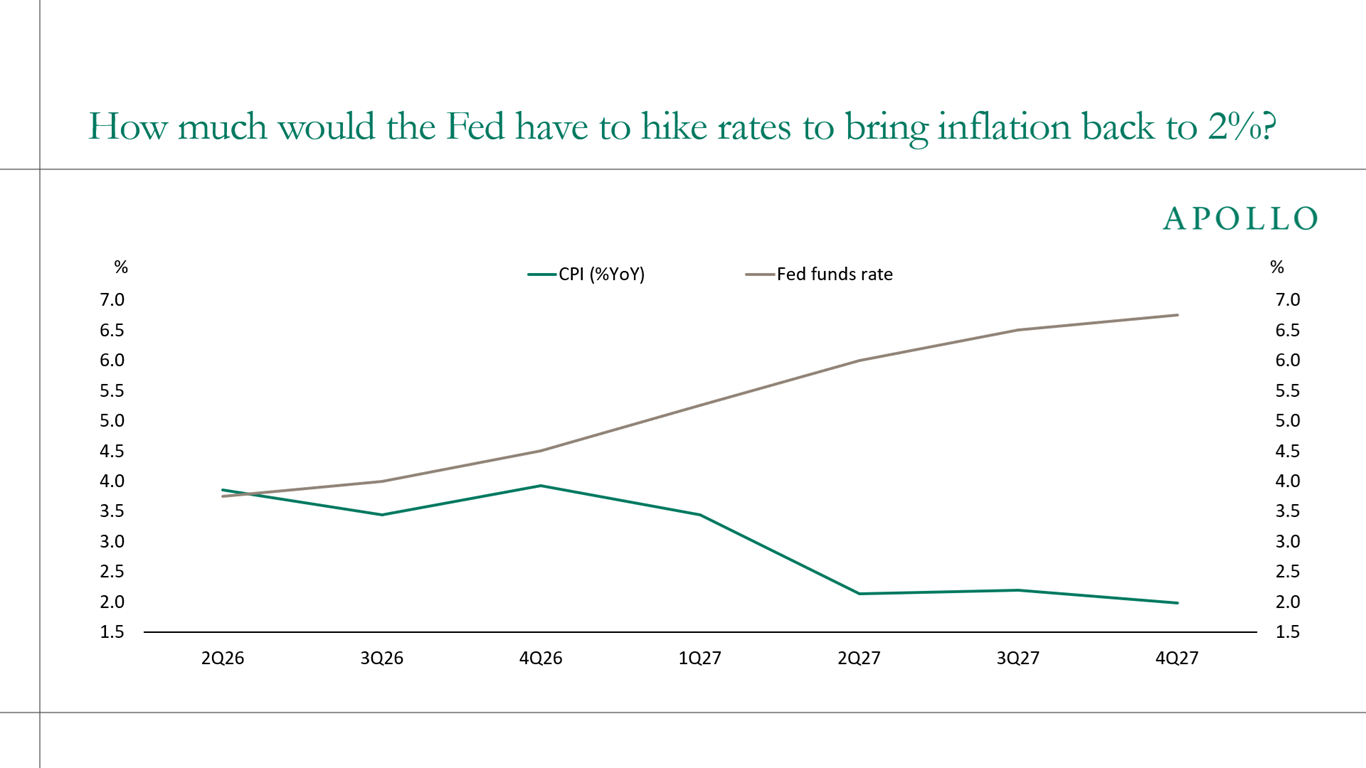
A macroeconomic model based on the historical relationship between interest rates, GDP and inflation suggests the Fed would need to raise the Fed funds rate by about 275 basis points, from roughly 4% today to 6.75% by the end of 2027, to bring CPI back to its 2% target. Inflation would not reach target until 2Q27, even with aggressive hikes.

The bottom line is that the Fed may be further from its inflation goal than the market currently expects.

Download high-res chart

See important disclaimers at the bottom of the page.

Monetary & Fiscal Policy

November 01, 2026

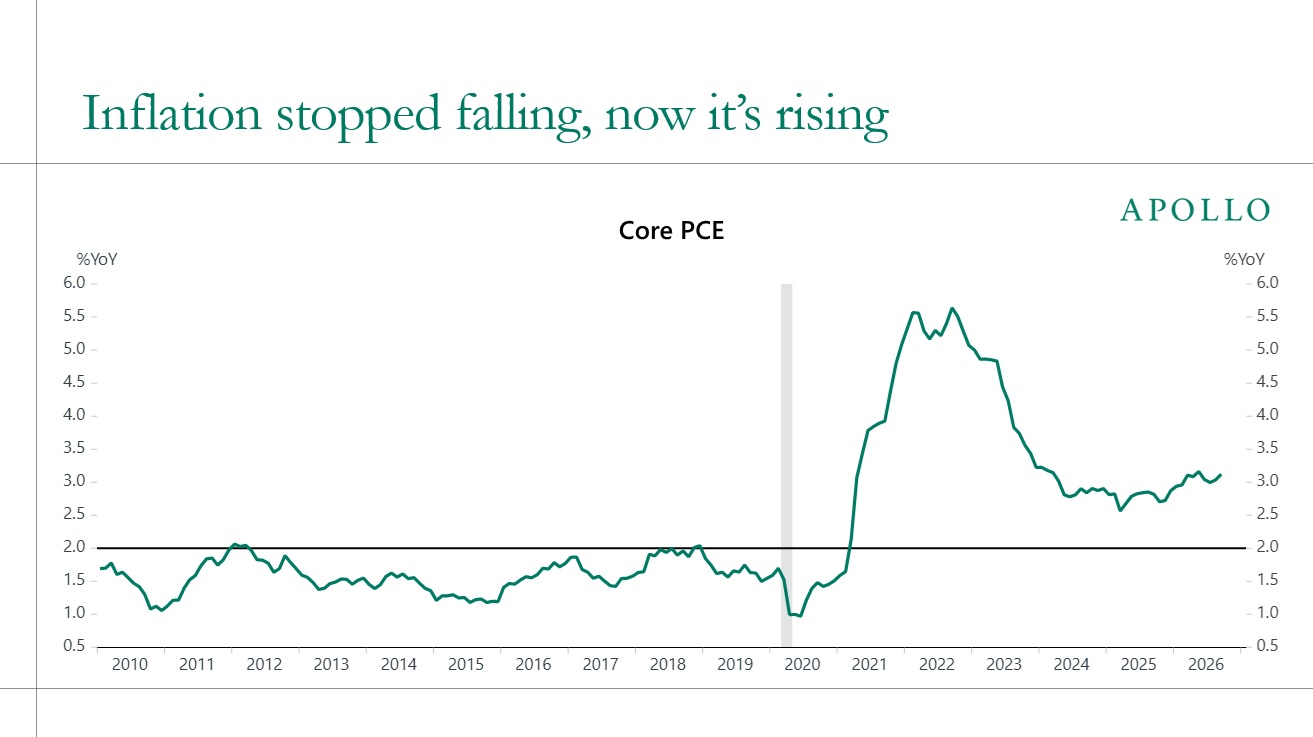
Inflation Stopped Falling, Now It’s Rising

Share

Core PCE inflation is supposed to be 2%. Unfortunately, it has been 3% for three years, and it is now moving higher, see chart below. This is the reason why the market is pricing that more Fed hikes are coming.

Download high-res chart

See important disclaimers at the bottom of the page.

No Daily Spark posts containing all your search terms were found.

Suggestions:

  • Make sure all words are spelled correctly.
  • Try different keywords.
  • Try more general keywords.

This presentation may not be distributed, transmitted or otherwise communicated to others in whole or in part without the express consent of Apollo Global Management, Inc. (together with its subsidiaries, “Apollo”).

Apollo makes no representation or warranty, expressed or implied, with respect to the accuracy, reasonableness, or completeness of any of the statements made during this presentation, including, but not limited to, statements obtained from third parties. Opinions, estimates and projections constitute the current judgment of the speaker as of the date indicated. They do not necessarily reflect the views and opinions of Apollo and are subject to change at any time without notice. Apollo does not have any responsibility to update this presentation to account for such changes. There can be no assurance that any trends discussed during this presentation will continue.

Statements made throughout this presentation are not intended to provide, and should not be relied upon for, accounting, legal or tax advice and do not constitute an investment recommendation or investment advice. Investors should make an independent investigation of the information discussed during this presentation, including consulting their tax, legal, accounting or other advisors about such information. Apollo does not act for you and is not responsible for providing you with the protections afforded to its clients. This presentation does not constitute an offer to sell, or the solicitation of an offer to buy, any security, product or service, including interest in any investment product or fund or account managed or advised by Apollo.

Certain statements made throughout this presentation may be “forward-looking” in nature. Due to various risks and uncertainties, actual events or results may differ materially from those reflected or contemplated in such forward-looking information. As such, undue reliance should not be placed on such statements. Forward-looking statements may be identified by the use of terminology including, but not limited to, “may”, “will”, “should”, “expect”, “anticipate”, “target”, “project”, “estimate”, “intend”, “continue” or “believe” or the negatives thereof or other variations thereon or comparable terminology.