Apollo stands as a key financing partner for some of the most innovative sectors driving our future.
July 10, 2026
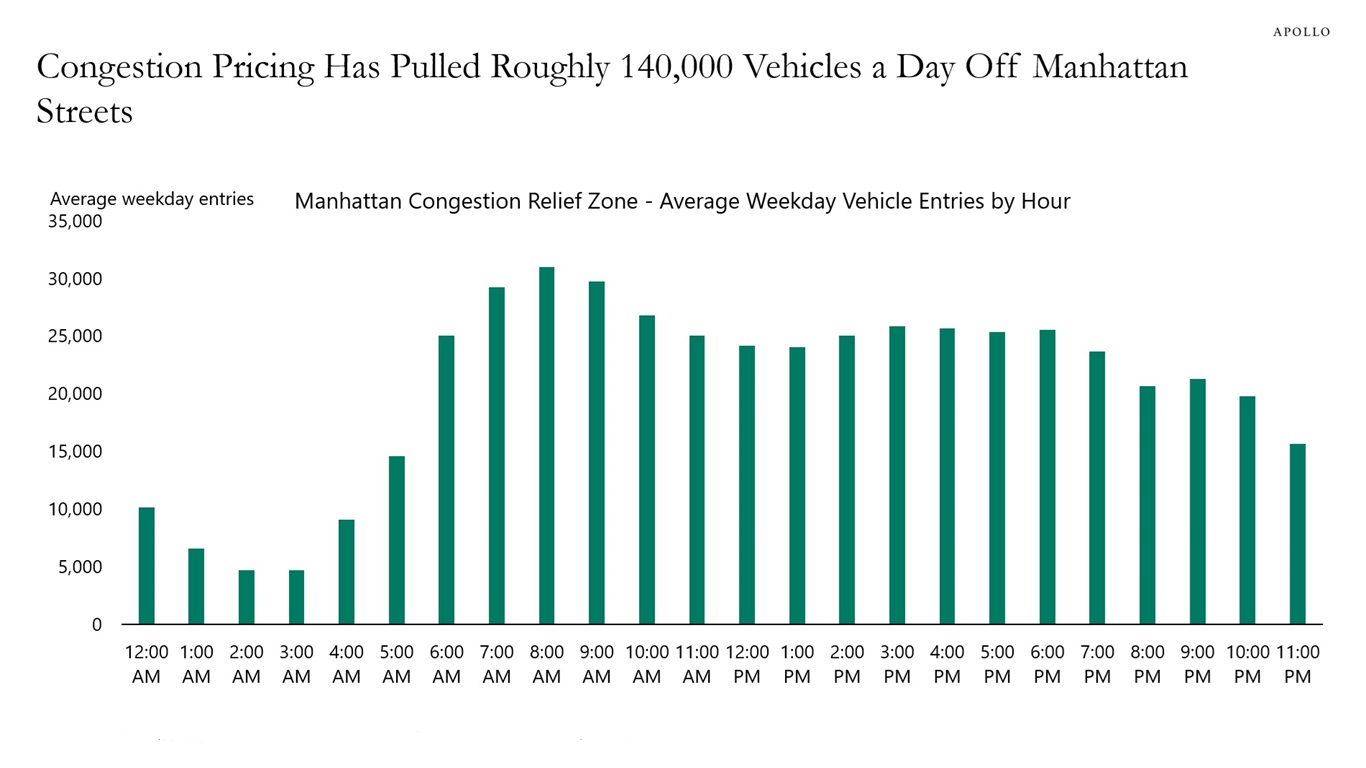
Since congestion pricing launched in January 2025, about 500,000 vehicles enter Manhattan's Congestion Relief Zone on a typical weekday. The MTA estimates daily entries have fallen roughly 13% from their pre-toll baseline of about 640,000. Entries peak near 31,000 at 8 am, then hold a broad plateau through the afternoon rather than spiking again at evening rush, see chart below.
Note: Vehicles entering the zone below 60th Street. Average of all weekdays (Mon–Fri) since January 5, 2025. Sources: MTA, Apollo Chief Economist
See important disclaimers at the bottom of the page.
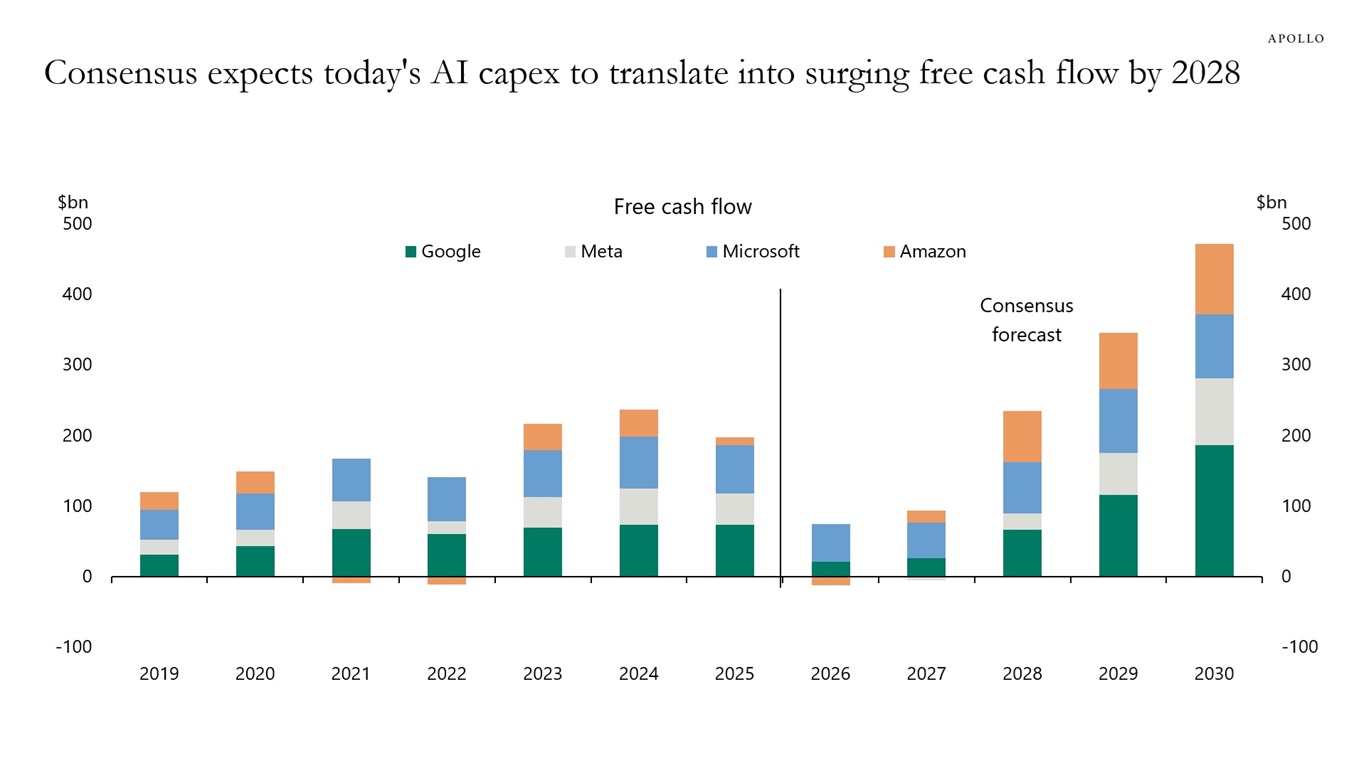
Consensus expects free cash flow for the hyperscalers to more than double over the coming years, see the first chart below.
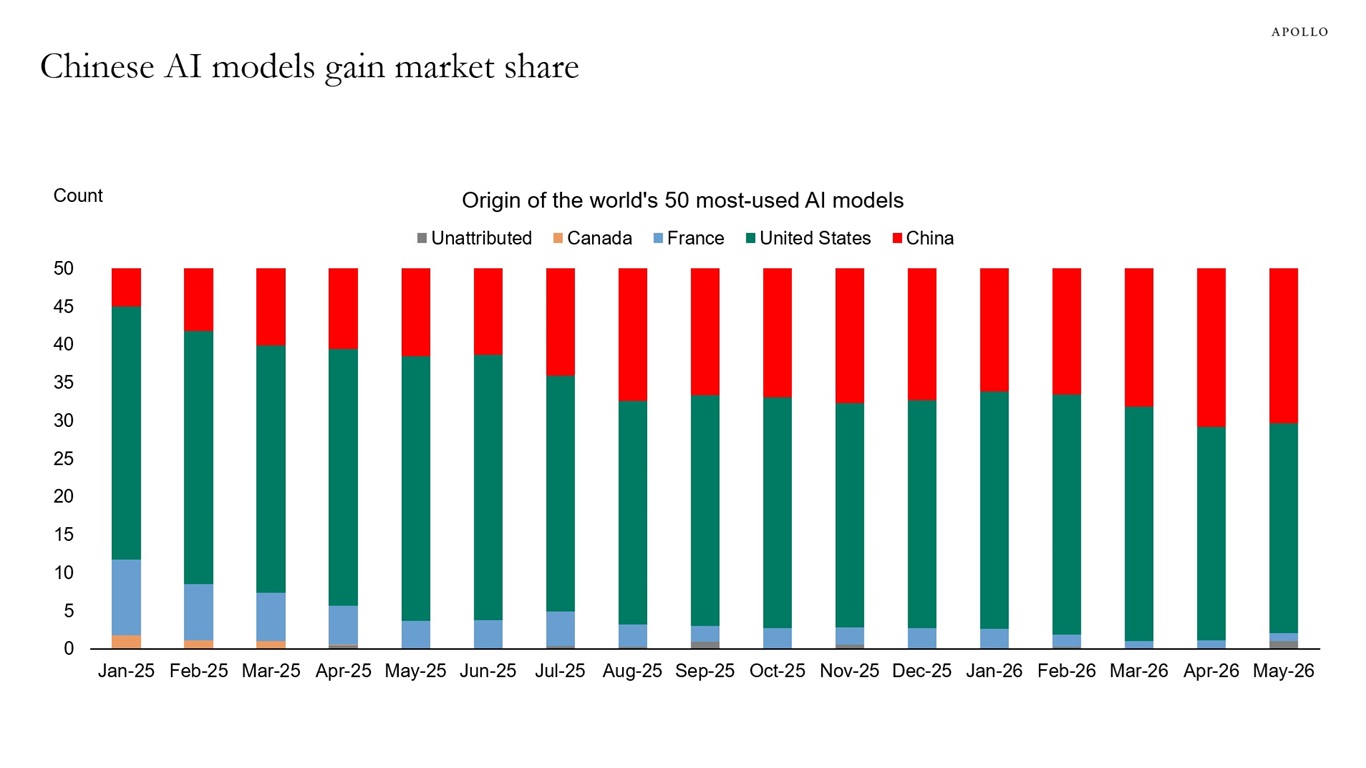
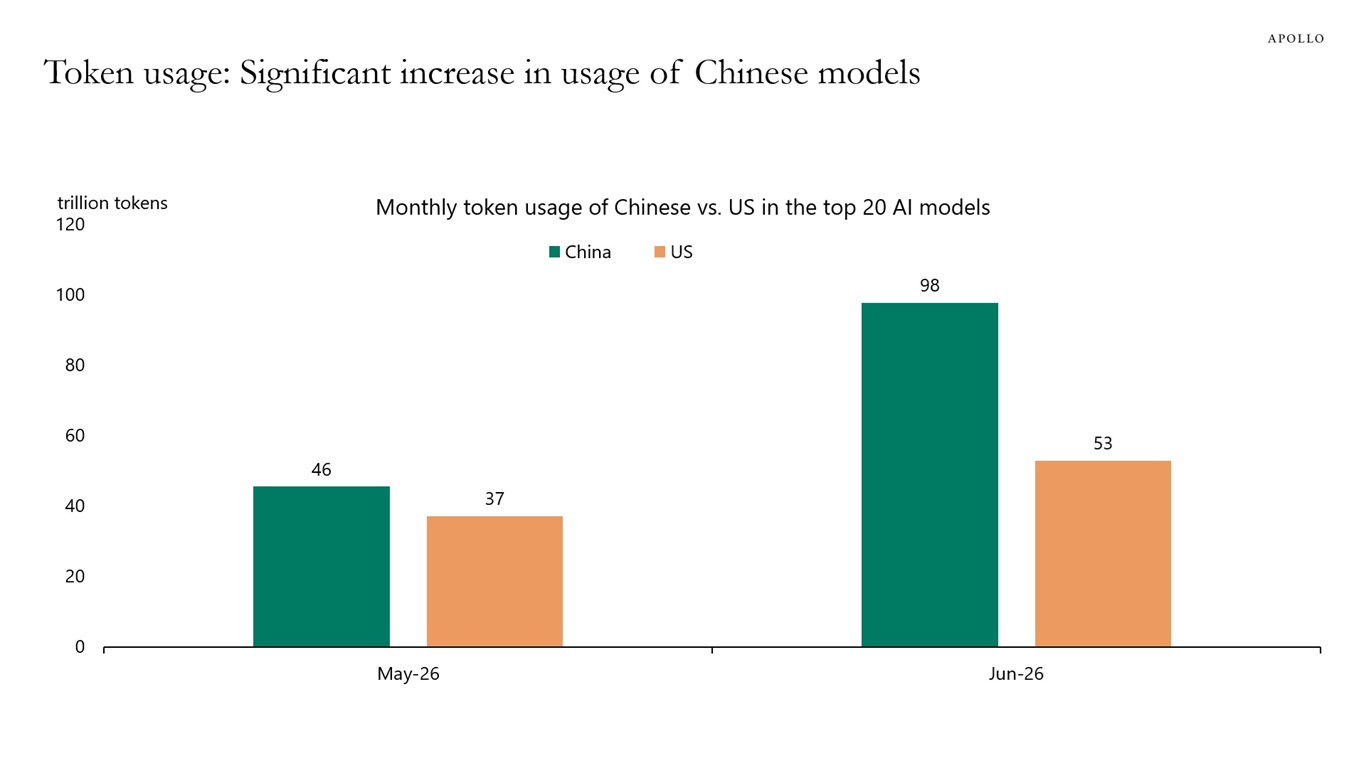
But what if the payoff takes longer than consensus assumes? That question is particularly pressing given that token prices continue to decline and Chinese models are gaining ground, both in their share of the world's most-used models and in token usage, where they now lead their US counterparts among the top 20 models, see the second and third charts.
If Chinese models keep gaining and token prices keep falling, the hyperscaler cash flows expected may prove too optimistic.
What are the consequences if the AI payoff comes slower than expected in the first chart?
1) Cash flows and earnings disappoint: the projected free cash flow surge slips later while committed capex and heavy depreciation hit on schedule, squeezing margins and marking down the forecast in the first chart.
2) A Mag 7 sell-off that takes the market with it: equity prices built on a fast payoff re-rate, and because the Magnificent 7 now account for so much of the indices, the pain can't stay contained, it spreads to chips, power, data centers and the S&P 500 as a whole.
3) Balance sheets stretch and credit risk rises: with internal cash unable to cover spending, hyperscalers lean further on debt, raising leverage and inviting possible ratings downgrades if profits lag.
The bottom line is that AI has been the one thing holding up both the economy and markets, and with so much riding on so few names, a slower payoff wouldn't just be a sector problem, it would risk tipping the economy into recession and the S&P 500 into a correction.
Sources: FactSet, Apollo Chief Economist
Sources: OurWorldinData.org, Apollo Chief Economist
Sources: LLM Rankings | OpenRouter, Apollo Chief Economist
See important disclaimers at the bottom of the page.
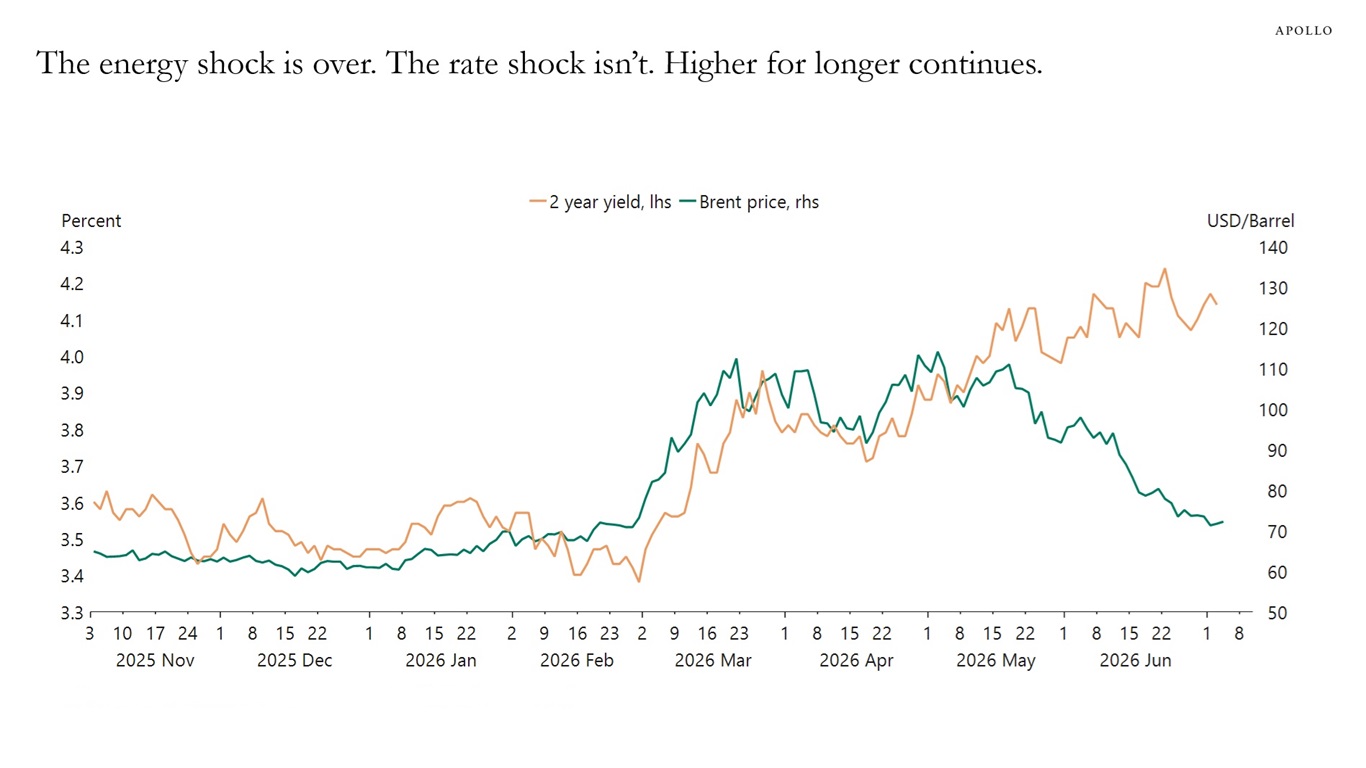
When oil and yields stop moving together, it signals the Fed's problem has shifted from headline to core, see chart below.
With tariffs, a tight labor market and firm services prices still in play, the market expects core inflation to stay sticky even as energy costs fall.
The bottom line is that cheaper oil alone won't open the door to cuts, and the Fed is likely to stay on hold at its next meeting until it sees core inflation convincingly cooling.
Sources: US Department of the Treasury, Macrobond, Apollo Chief Economist
See important disclaimers at the bottom of the page.
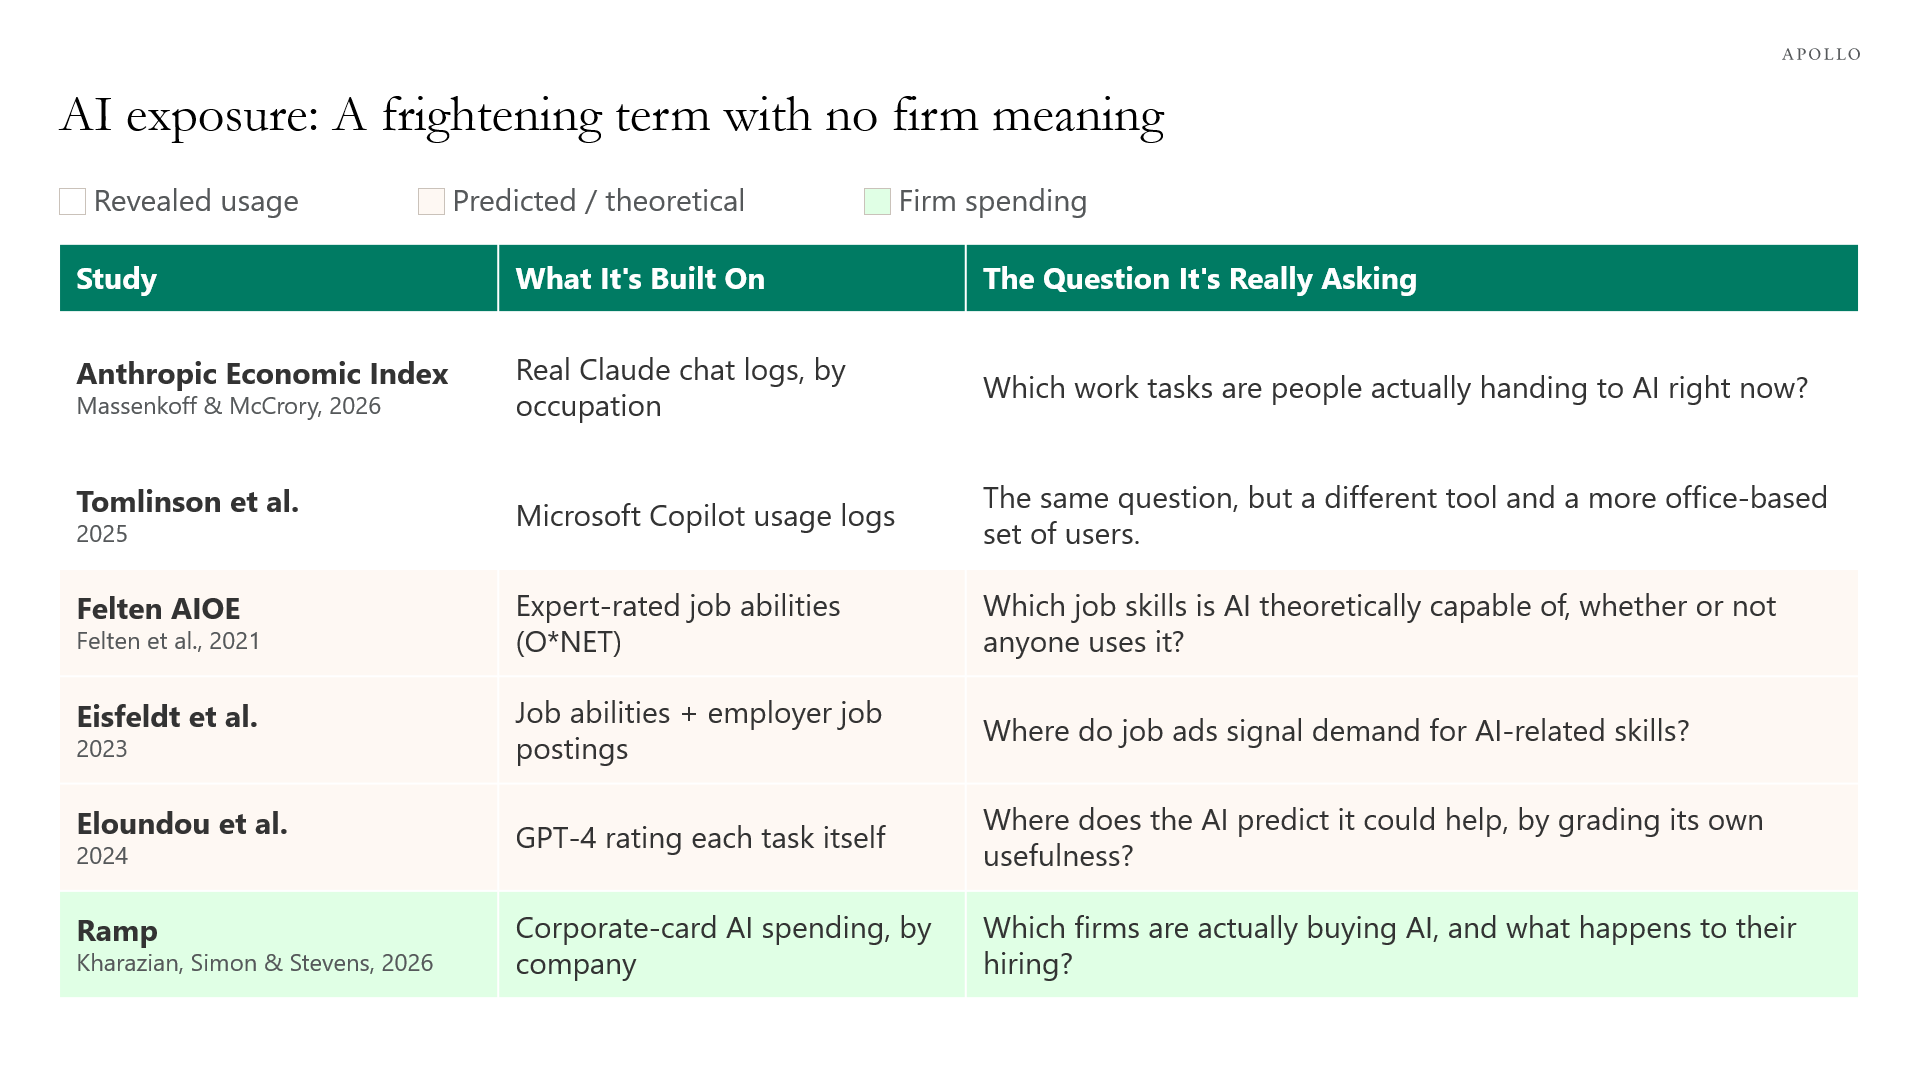
Everyone talks about AI exposure in the labor market, but the reality is that there is no consensus about what this means.
This is illustrated by the five measures currently used in studies quantifying the impact of AI on the labor market:
"What could AI do to this job?" and "What are workers actually using AI for?" are not the same question, and the theoretical measures (3, 4 and 5) run systematically higher than the usage-based ones (1 and 2) because they ignore whether adoption is even happening or worth the cost.
As a result, many occupations look highly exposed under one measure and barely touched under another.
What is most striking is that the five measures disagree most exactly where the stakes are highest, among the very jobs everyone wants to flag as at-risk, such as telemarketers, tax preparers and writers.
The bottom line is that when someone says a job is "highly exposed to AI," the honest first question is: Exposed by which measure, and measuring what? Until that is pinned down, the label "AI exposure" carries far less meaning than it appears to.
My colleague Sania Edlich and I will dig further into this in upcoming Sparks.
Sources: Massenkoff & McCrory (2026); Tomlinson et al. (2025); Felten et al. (2021); Eisfeldt et al. (2023); Eloundou et al. (2024); Kharazian, Simon & Stevens (2026); Apollo Chief Economist
See important disclaimers at the bottom of the page.
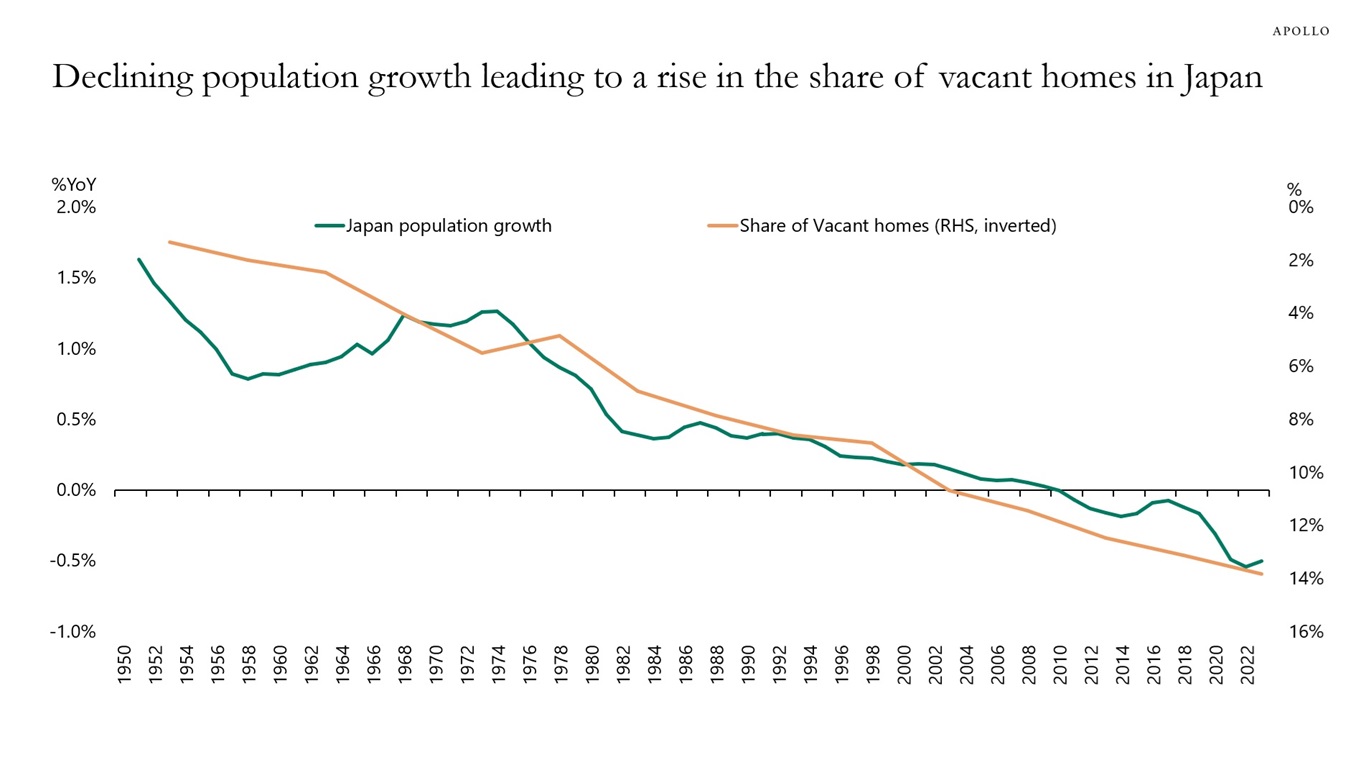
Japan's shrinking population has left 14% of its housing stock vacant, a share that has risen for decades and shows no sign of reversing, see chart below.
Sources: UN, Haver Analytics, Apollo Chief Economist
See important disclaimers at the bottom of the page.
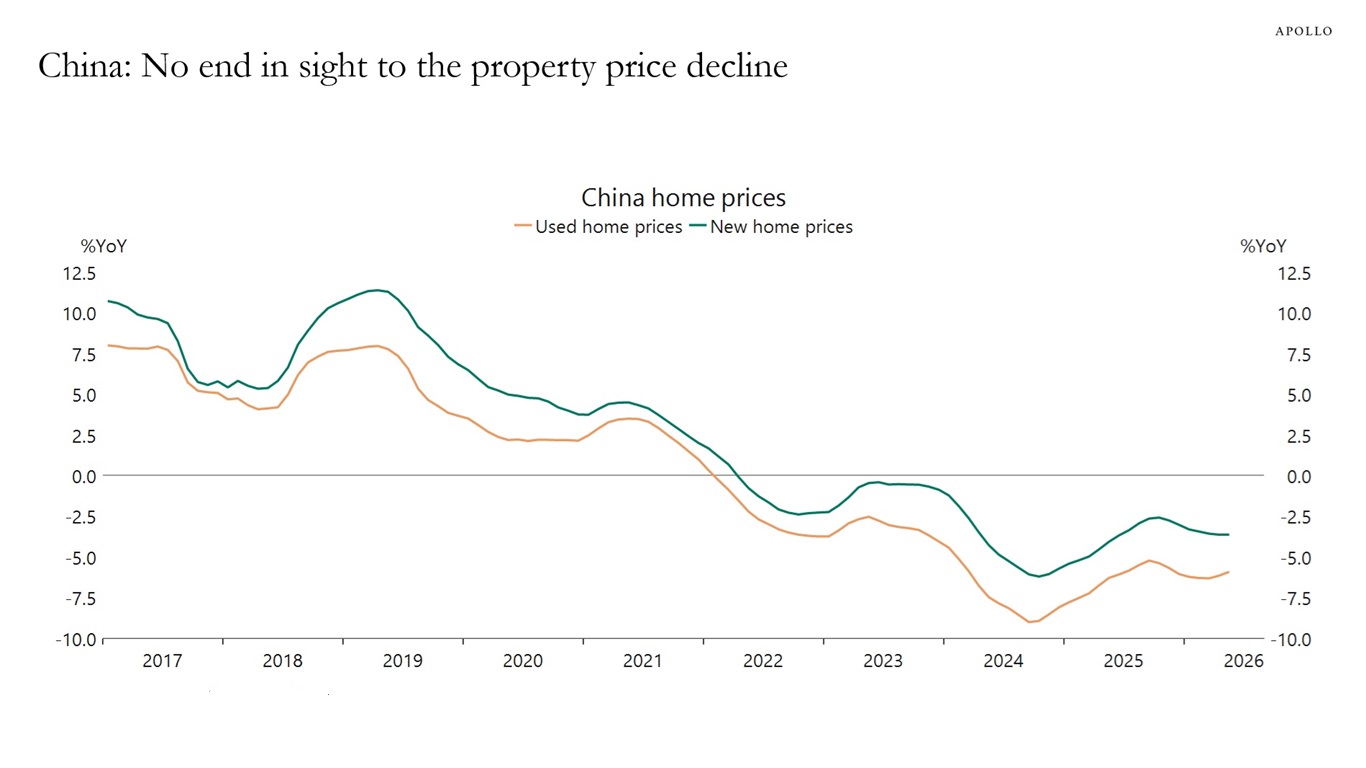
China's home prices have now been falling for four straight years, with both new and used home prices stuck in negative territory since 2022, see chart below.
Sources: Bloomberg, Macrobond, Apollo Chief Economist
See important disclaimers at the bottom of the page.
July 04, 2026
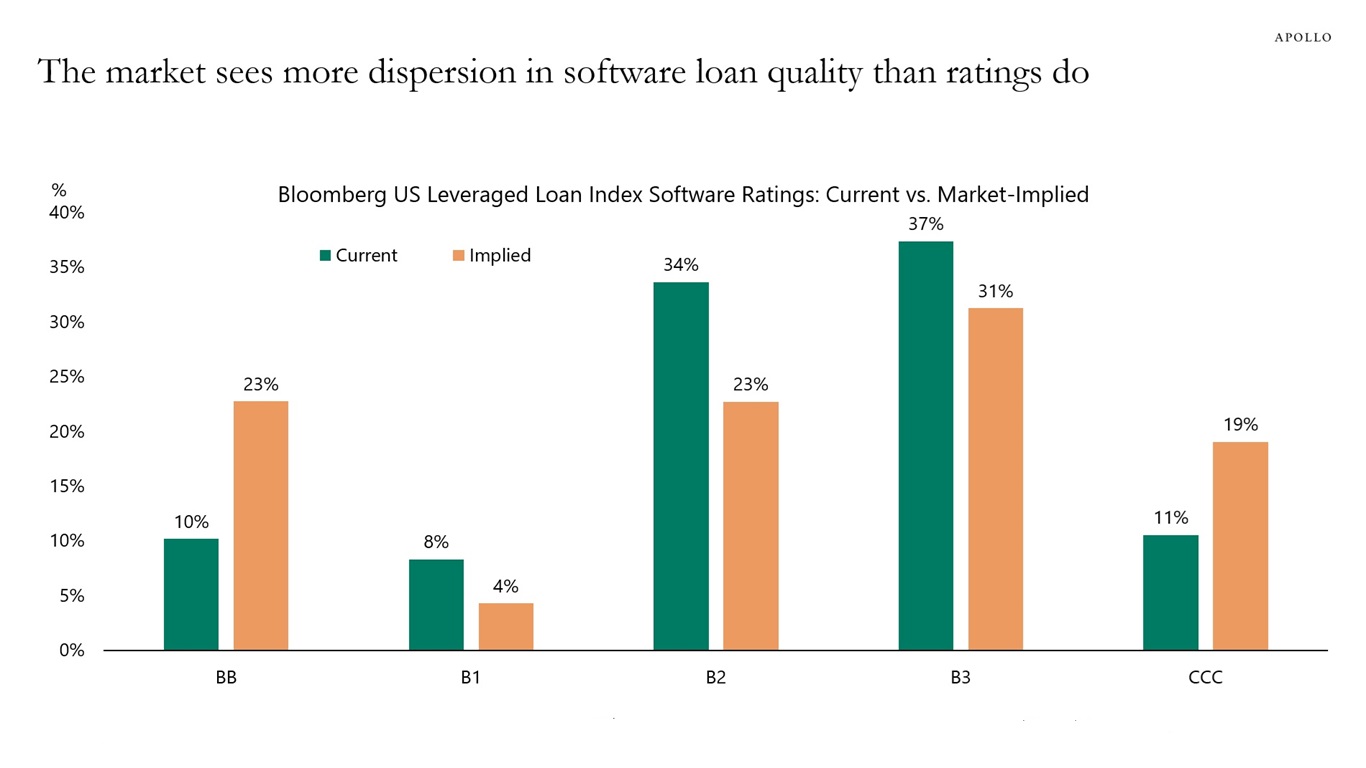
Current ratings for software loans cluster heavily in the B2 and B3 buckets, but market-implied ratings spread loans toward both ends, a sign the market sees more credit dispersion in software leveraged loans than agency ratings currently reflect.
Note: For each software loan, we look at its price, compare it to the simple-average price of every rating bucket across the whole loan index, and assign it the rating whose bucket-average price is closest. Then we sum each implied rating's share by market value. Sources: Bloomberg, Apollo Chief Economist
See important disclaimers at the bottom of the page.
July 03, 2026
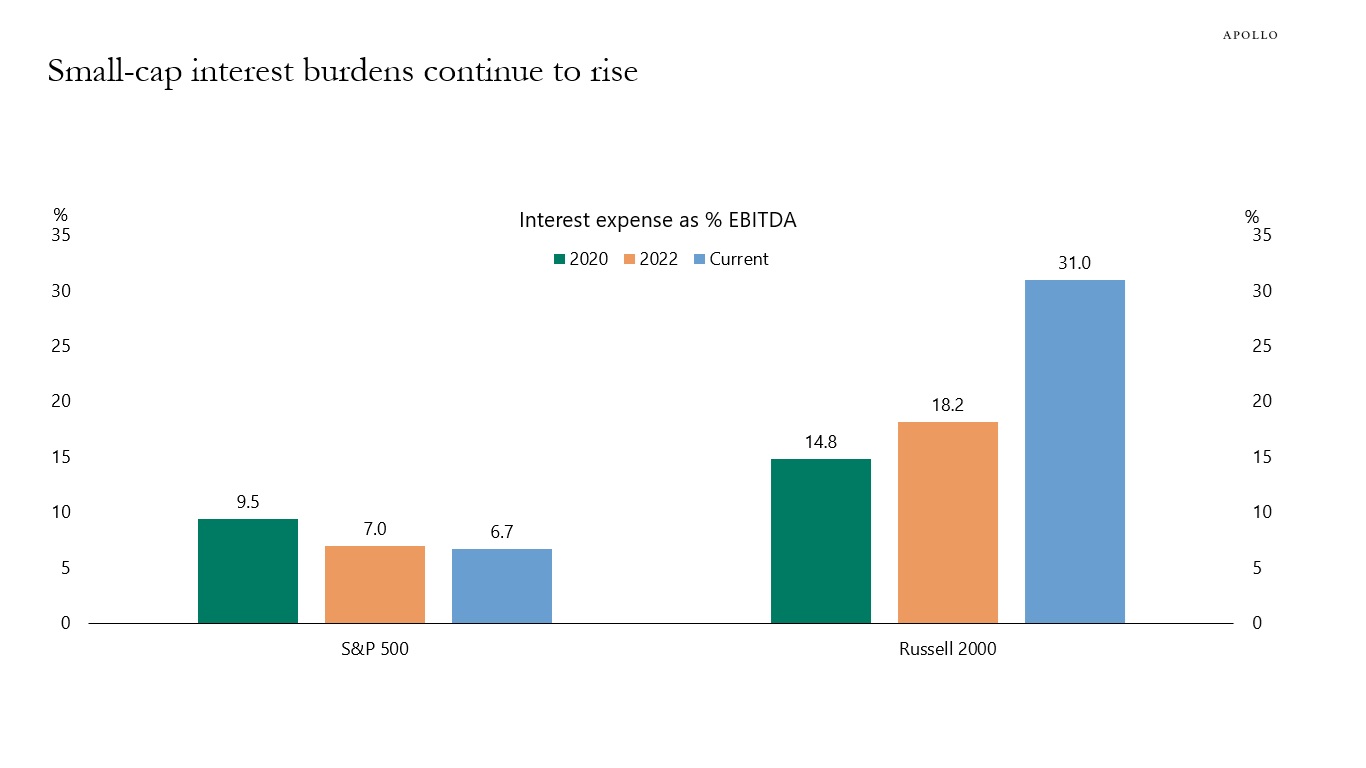
With more than 40% of Russell 2000 companies unprofitable, a higher-for-longer rate environment drives up debt servicing costs, threatening middle-market firms as interest costs take up a growing share of earnings, see chart below.
Sources: Bloomberg, Apollo Chief Economist
See important disclaimers at the bottom of the page.
July 02, 2026
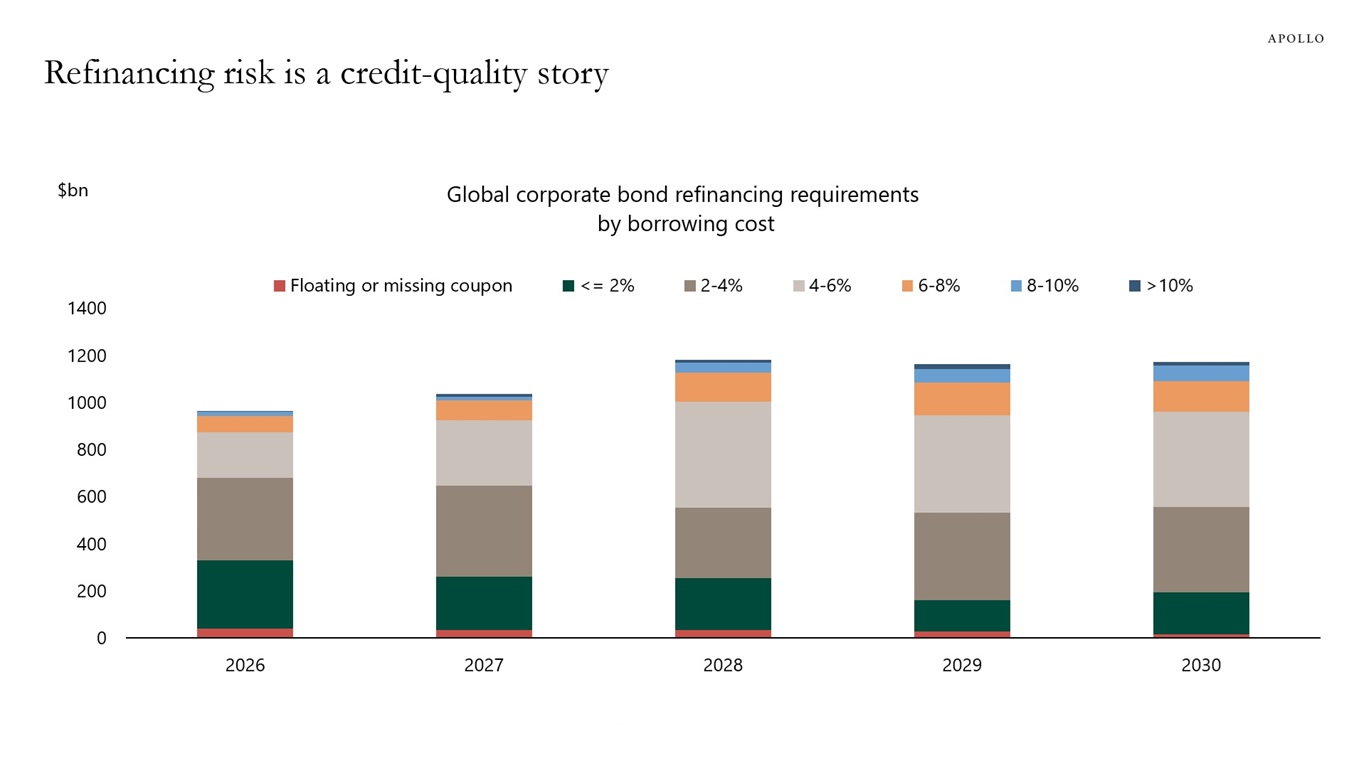
A wave of corporate bonds issued during the low-rate era of 2020 and 2021 is now coming due, forcing companies to refinance cheap debt at today's higher rates, with high-yield borrowers feeling the squeeze first given their shorter 5-to-8-year maturities, while investment-grade issuers sit in a stronger position today, having locked in low rates with 10-year-plus tenors that push their refinancing needs comfortably further out. With the Fed potentially hiking rates later this year, the bottom line is that rates higher for longer continue to have a bigger negative impact on lower-quality credits.
Note: Chart shows bonds issued by non-financial corporations maturing in 2026-30 by cost. Sources: OECD Economic Outlook, Volume 2026 Issue 1 | OECD, Apollo Chief Economist
See important disclaimers at the bottom of the page.
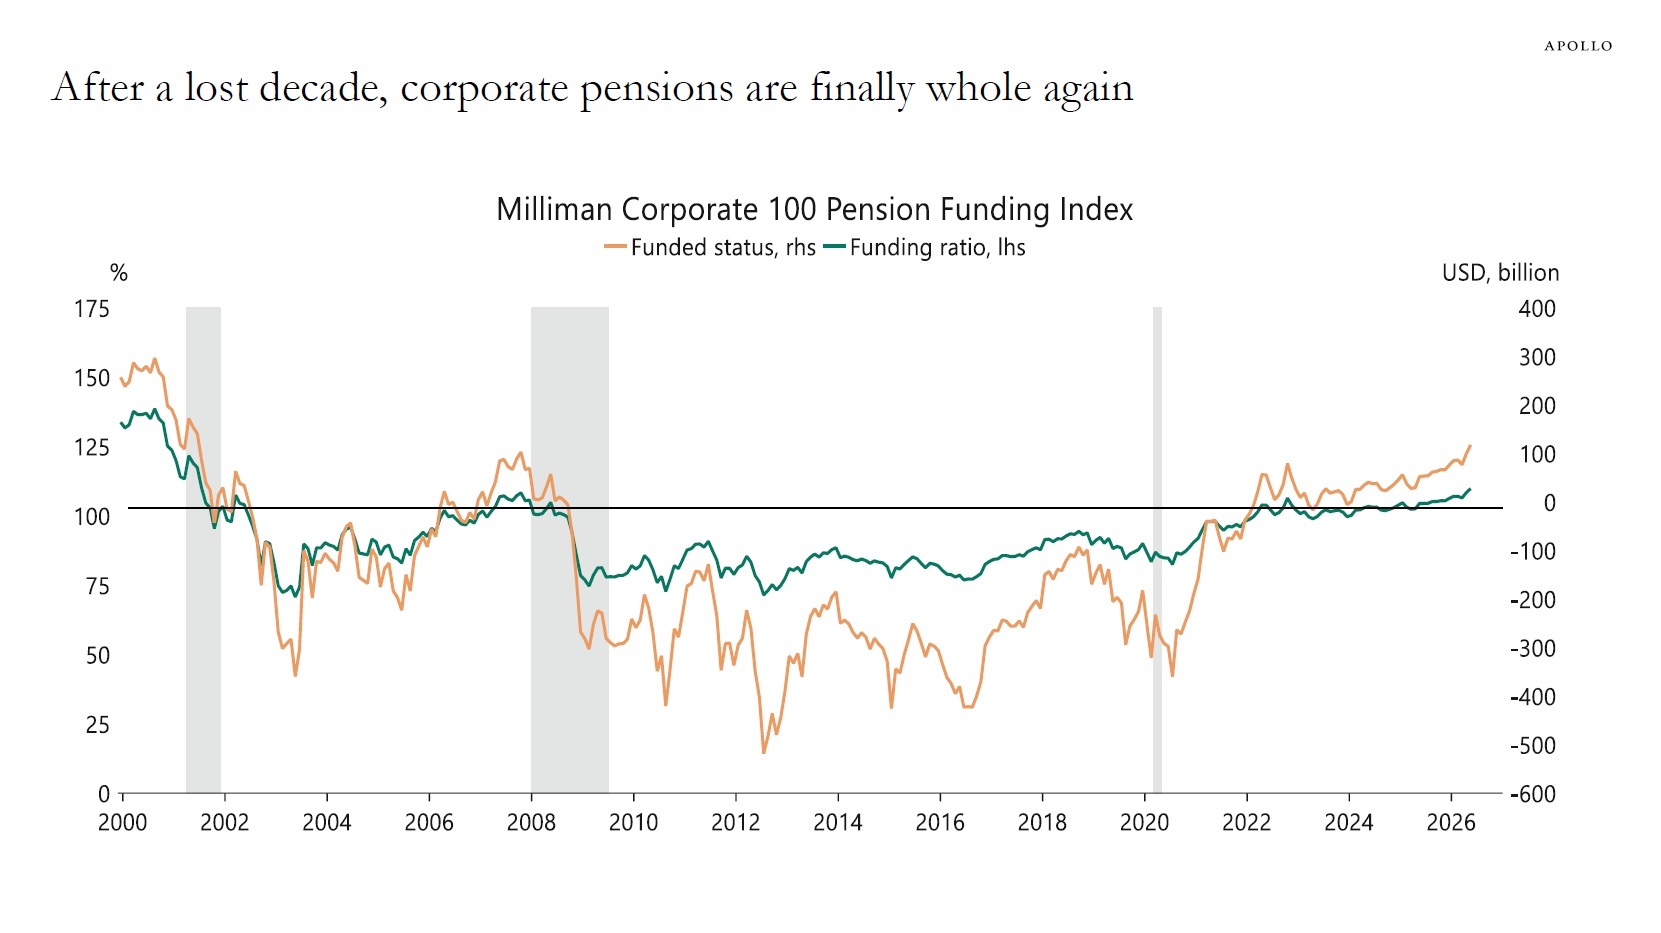
Corporate pensions are fully funded again for the first time in almost two decades, see chart below.
With rates still high, plans can lock in attractive yields now by replacing return-seeking assets with liability-matched fixed income and guard against the risk that falling rates during the next downturn reinflate their liabilities and erase the surplus.
Note: Funded status measures planned assets minus projected benefit obligation. Sources: Milliman, Macrobond, Apollo Chief Economist
See important disclaimers at the bottom of the page.